
 Yahoo Finance
 What Kind Of Risk Should You Expect For FutureFuel Corp (NYSE:FF)?

If you are looking to invest in FutureFuel Corp’s (NYSE:FF), or currently own the stock, then you need to understand its beta in order to understand how it can affect the risk of your portfolio. Every stock in the market is exposed to market risk, which arises from macroeconomic factors such as economic growth and geo-political tussles just to name a few. This is measured by its beta. Not all stocks are expose to the same level of market risk, and the market as a whole represents a beta value of one. A stock with a beta greater than one is expected to exhibit higher volatility resulting from market-wide shocks compared to one with a beta below one.
See our latest analysis for FutureFuel
How volatile is FF’s share price?
With a beta of 1.59, FutureFuel is a stock that tends to see greater volatility than the market at large. Based on this beta value, FF can help magnify your portfolio return, especially if it is predominantly made up of low-beta stocks. If the market is going up, a higher exposure to the upside from a high-beta stock can push up your portfolio return.
How does FF’s size and industry impact its risk?
With a market cap of US$621.15m, FF falls within the small-cap spectrum of stocks, which are found to experience higher relative risk compared to larger companies. Furthermore, the company operates in the chemicals industry, which has been found to have high sensitivity to market-wide shocks. So, investors should expect a larger beta for smaller companies operating in a cyclical industry in contrast with lower beta for larger firms in a more defensive industry. This supports our interpretation of FF’s beta value discussed above. Next, we will examine the fundamental factors which can cause cyclicality in the stock.
Is FF’s cost structure indicative of a high beta?
An asset-heavy company tends to have a higher beta because the risk associated with running fixed assets during a downturn is highly expensive. I examine FF’s ratio of fixed assets to total assets to see whether the company is highly exposed to the risk of this type of constraint. With a fixed-assets-to-total-assets ratio of greater than 30%, FF appears to be a company that invests a large amount of capital in assets that are hard to scale down on short-notice. Thus, we can expect FF to be more volatile in the face of market movements, relative to its peers of similar size but with a lower proportion of fixed assets on their books. Similarly, FF’s beta value conveys the same message.
What this means for you:
You could benefit from higher returns from FF during times of economic growth. Its higher fixed cost isn’t a major concern given margins are covered with high consumer demand. Though, in times of a downturn, it may be safe to look at a more defensive stock which can cushion the impact of lower demand. What I have not mentioned in my article here are important company-specific fundamentals such as FutureFuel’s financial health and performance track record. I urge you to complete your research by taking a look at the following:
Future Outlook: What are well-informed industry analysts predicting for FF’s future growth? Take a look at our free research report of analyst consensus for FF’s outlook.
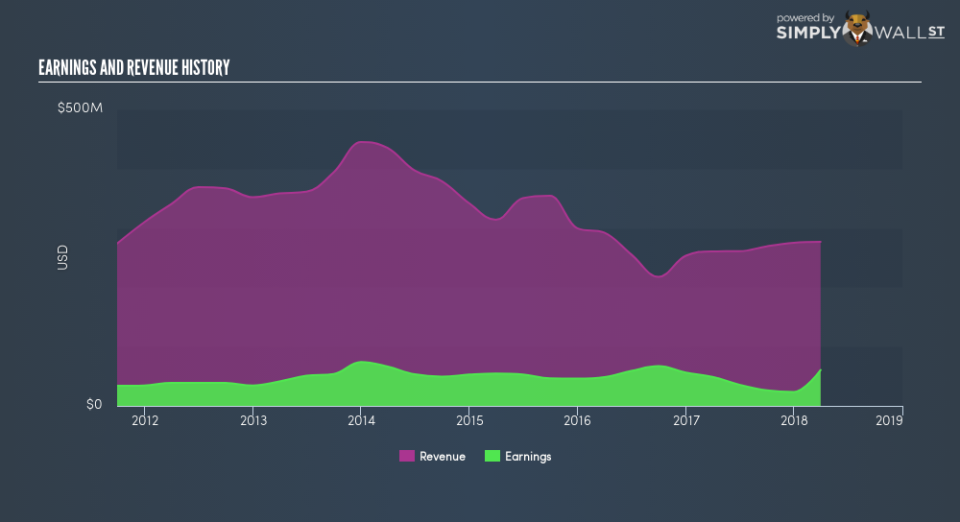
Past Track Record: Has FF been consistently performing well irrespective of the ups and downs in the market? Go into more detail in the past performance analysis and take a look at the free visual representations of FF’s historicals for more clarity.
Other High-Performing Stocks: Are there other stocks that provide better prospects with proven track records? Explore our free list of these great stocks here.
To help readers see past the short term volatility of the financial market, we aim to bring you a long-term focused research analysis purely driven by fundamental data. Note that our analysis does not factor in the latest price-sensitive company announcements.
The author is an independent contributor and at the time of publication had no position in the stocks mentioned. For errors that warrant correction please contact the editor at editorial-team@simplywallst.com.
