
 Yahoo Finance
 What Kind Of Shareholders Own Severn Trent Plc (LON:SVT)?

A look at the shareholders of Severn Trent Plc (LON:SVT) can tell us which group is most powerful. Insiders often own a large chunk of younger, smaller, companies while huge companies tend to have institutions as shareholders. Companies that used to be publicly owned tend to have lower insider ownership.
Severn Trent has a market capitalization of UK£4.9b, so it's too big to fly under the radar. We'd expect to see both institutions and retail investors owning a portion of the company. Taking a look at our data on the ownership groups (below), it's seems that institutions are noticeable on the share registry. Let's delve deeper into each type of owner, to discover more about SVT.
See our latest analysis for Severn Trent
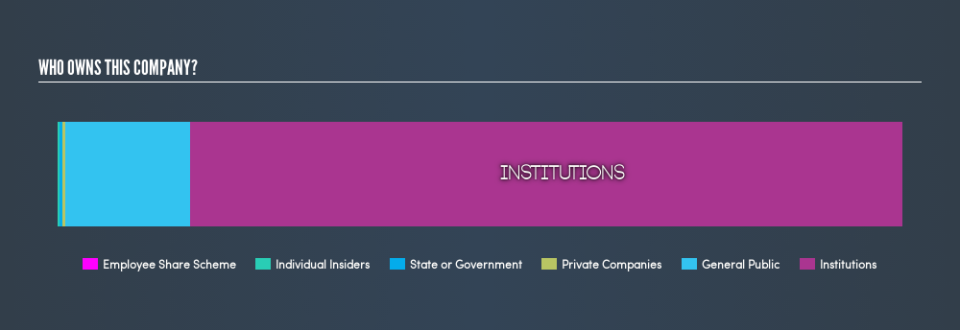
What Does The Institutional Ownership Tell Us About Severn Trent?
Institutional investors commonly compare their own returns to the returns of a commonly followed index. So they generally do consider buying larger companies that are included in the relevant benchmark index.
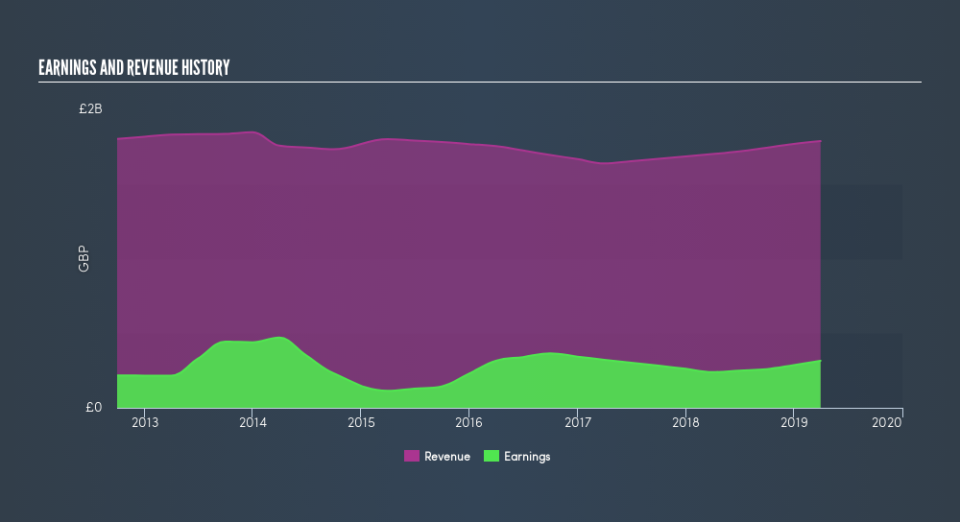
As you can see, institutional investors own 84% of Severn Trent. This suggests some credibility amongst professional investors. But we can't rely on that fact alone, since institutions make bad investments sometimes, just like everyone does. If multiple institutions change their view on a stock at the same time, you could see the share price drop fast. It's therefore worth looking at Severn Trent's earnings history, below. Of course, the future is what really matters.
Institutional investors own over 50% of the company, so together than can probably strongly influence board decisions. We note that hedge funds don't have a meaningful investment in Severn Trent. Quite a few analysts cover the stock, so you could look into forecast growth quite easily.
Insider Ownership Of Severn Trent
The definition of an insider can differ slightly between different countries, but members of the board of directors always count. Management ultimately answers to the board. However, it is not uncommon for managers to be executive board members, especially if they are a founder or the CEO.
Most consider insider ownership a positive because it can indicate the board is well aligned with other shareholders. However, on some occasions too much power is concentrated within this group.
Our information suggests that Severn Trent Plc insiders own under 1% of the company. It is a pretty big company, so it would be possible for board members to own a meaningful interest in the company, without owning much of a proportional interest. In this case, they own around UK£8.3m worth of shares (at current prices). It is good to see board members owning shares, but it might be worth checking if those insiders have been buying.
General Public Ownership
The general public, with a 15% stake in the company, will not easily be ignored. While this group can't necessarily call the shots, it can certainly have a real influence on how the company is run.
Next Steps:
It's always worth thinking about the different groups who own shares in a company. But to understand Severn Trent better, we need to consider many other factors.
I always like to check for a history of revenue growth. You can too, by accessing this free chart of historic revenue and earnings in this detailed graph.
If you would prefer discover what analysts are predicting in terms of future growth, do not miss this free report on analyst forecasts.
NB: Figures in this article are calculated using data from the last twelve months, which refer to the 12-month period ending on the last date of the month the financial statement is dated. This may not be consistent with full year annual report figures.
We aim to bring you long-term focused research analysis driven by fundamental data. Note that our analysis may not factor in the latest price-sensitive company announcements or qualitative material.
If you spot an error that warrants correction, please contact the editor at editorial-team@simplywallst.com. This article by Simply Wall St is general in nature. It does not constitute a recommendation to buy or sell any stock, and does not take account of your objectives, or your financial situation. Simply Wall St has no position in the stocks mentioned. Thank you for reading.
