
 Yahoo Finance
 Do You Know What The Interpublic Group of Companies, Inc.'s (NYSE:IPG) P/E Ratio Means?

Today, we'll introduce the concept of the P/E ratio for those who are learning about investing. We'll apply a basic P/E ratio analysis to The Interpublic Group of Companies, Inc.'s (NYSE:IPG), to help you decide if the stock is worth further research. Interpublic Group of Companies has a price to earnings ratio of 13.59, based on the last twelve months. That corresponds to an earnings yield of approximately 7.4%.
See our latest analysis for Interpublic Group of Companies
How Do You Calculate A P/E Ratio?
The formula for price to earnings is:
Price to Earnings Ratio = Share Price ÷ Earnings per Share (EPS)
Or for Interpublic Group of Companies:
P/E of 13.59 = $23.04 ÷ $1.70 (Based on the year to September 2019.)
Is A High Price-to-Earnings Ratio Good?
A higher P/E ratio means that investors are paying a higher price for each $1 of company earnings. That isn't a good or a bad thing on its own, but a high P/E means that buyers have a higher opinion of the business's prospects, relative to stocks with a lower P/E.
Does Interpublic Group of Companies Have A Relatively High Or Low P/E For Its Industry?
The P/E ratio essentially measures market expectations of a company. The image below shows that Interpublic Group of Companies has a lower P/E than the average (15.0) P/E for companies in the media industry.
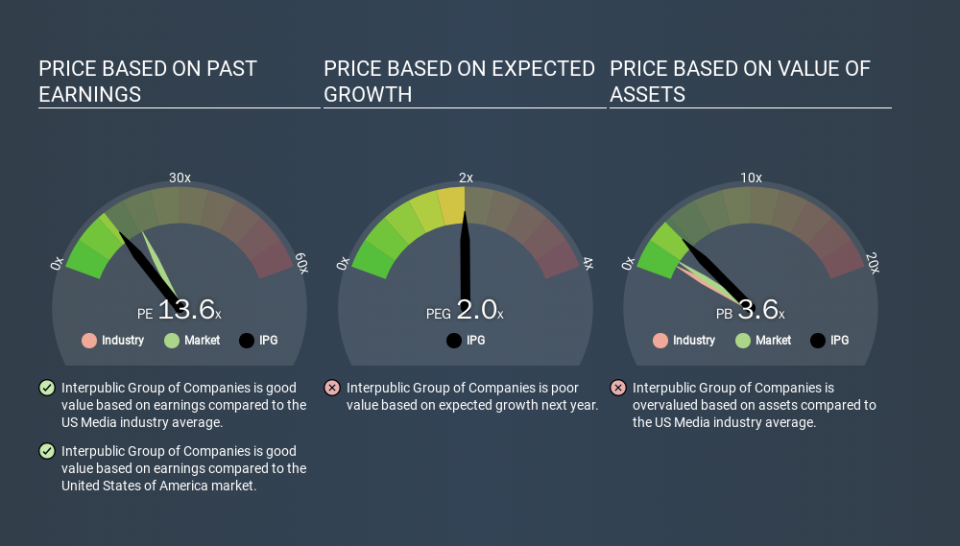
Interpublic Group of Companies's P/E tells us that market participants think it will not fare as well as its peers in the same industry. While current expectations are low, the stock could be undervalued if the situation is better than the market assumes. It is arguably worth checking if insiders are buying shares, because that might imply they believe the stock is undervalued.
How Growth Rates Impact P/E Ratios
Earnings growth rates have a big influence on P/E ratios. When earnings grow, the 'E' increases, over time. And in that case, the P/E ratio itself will drop rather quickly. And as that P/E ratio drops, the company will look cheap, unless its share price increases.
Most would be impressed by Interpublic Group of Companies earnings growth of 19% in the last year. And earnings per share have improved by 15% annually, over the last five years. With that performance, you might expect an above average P/E ratio.
Don't Forget: The P/E Does Not Account For Debt or Bank Deposits
One drawback of using a P/E ratio is that it considers market capitalization, but not the balance sheet. That means it doesn't take debt or cash into account. In theory, a company can lower its future P/E ratio by using cash or debt to invest in growth.
Such expenditure might be good or bad, in the long term, but the point here is that the balance sheet is not reflected by this ratio.
Is Debt Impacting Interpublic Group of Companies's P/E?
Interpublic Group of Companies has net debt equal to 35% of its market cap. You'd want to be aware of this fact, but it doesn't bother us.
The Bottom Line On Interpublic Group of Companies's P/E Ratio
Interpublic Group of Companies's P/E is 13.6 which is below average (18.9) in the US market. The EPS growth last year was strong, and debt levels are quite reasonable. If the company can continue to grow earnings, then the current P/E may be unjustifiably low.
Investors have an opportunity when market expectations about a stock are wrong. If it is underestimating a company, investors can make money by buying and holding the shares until the market corrects itself. So this free visualization of the analyst consensus on future earnings could help you make the right decision about whether to buy, sell, or hold.
Of course you might be able to find a better stock than Interpublic Group of Companies. So you may wish to see this free collection of other companies that have grown earnings strongly.
If you spot an error that warrants correction, please contact the editor at editorial-team@simplywallst.com. This article by Simply Wall St is general in nature. It does not constitute a recommendation to buy or sell any stock, and does not take account of your objectives, or your financial situation. Simply Wall St has no position in the stocks mentioned.
We aim to bring you long-term focused research analysis driven by fundamental data. Note that our analysis may not factor in the latest price-sensitive company announcements or qualitative material. Thank you for reading.
