
 Yahoo Finance
 Such Is Life: How Just Group (LON:JUST) Shareholders Saw Their Shares Drop 67%

Want to participate in a short research study? Help shape the future of investing tools and you could win a $250 gift card!
Generally speaking long term investing is the way to go. But no-one is immune from buying too high. For example the Just Group plc (LON:JUST) share price dropped 67% over five years. That's not a lot of fun for true believers. And we doubt long term believers are the only worried holders, since the stock price has declined 65% over the last twelve months. Shareholders have had an even rougher run lately, with the share price down 49% in the last 90 days.
Check out our latest analysis for Just Group
While markets are a powerful pricing mechanism, share prices reflect investor sentiment, not just underlying business performance. One way to examine how market sentiment has changed over time is to look at the interaction between a company's share price and its earnings per share (EPS).
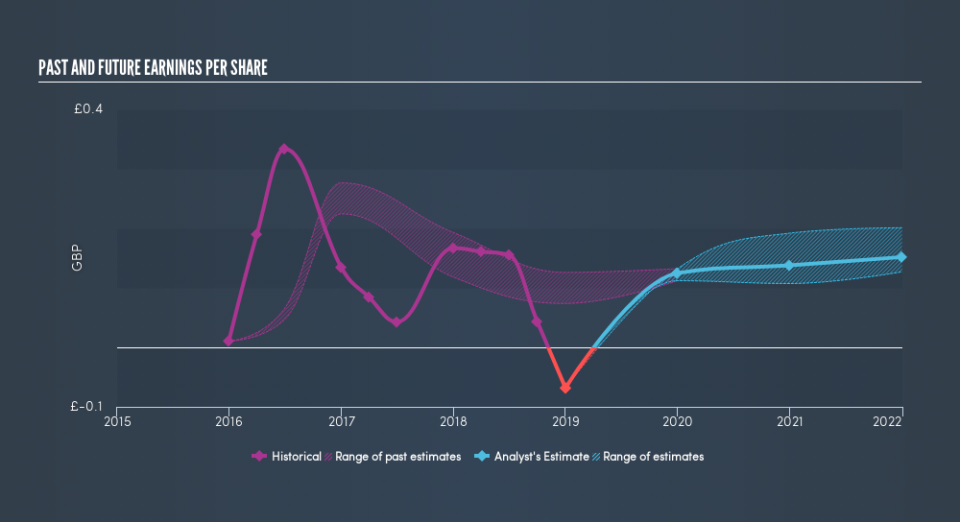
In the last half decade Just Group saw its share price fall as its EPS declined below zero. Since the company has fallen to a loss making position, it's hard to compare the change in EPS with the share price change. But we would generally expect a lower price, given the situation.
The company's earnings per share (over time) is depicted in the image below (click to see the exact numbers).
Dive deeper into Just Group's key metrics by checking this interactive graph of Just Group's earnings, revenue and cash flow.
A Dividend Lost
The value of past dividends are accounted for in the total shareholder return (TSR), but not in the share price return mentioned above. By accounting for the value of dividends paid, the TSR can be seen as a more complete measure of the value a company brings to its shareholders. Over the last 5 years, Just Group generated a TSR of -64%, which is, of course, better than the share price return. Even though the company isn't paying dividends at the moment, it has done in the past.
A Different Perspective
While the broader market gained around 0.2% in the last year, Just Group shareholders lost 65%. Even the share prices of good stocks drop sometimes, but we want to see improvements in the fundamental metrics of a business, before getting too interested. Unfortunately, last year's performance may indicate unresolved challenges, given that it was worse than the annualised loss of 18% over the last half decade. Generally speaking long term share price weakness can be a bad sign, though contrarian investors might want to research the stock in hope of a turnaround. If you would like to research Just Group in more detail then you might want to take a look at whether insiders have been buying or selling shares in the company.
Of course, you might find a fantastic investment by looking elsewhere. So take a peek at this free list of companies we expect will grow earnings.
Please note, the market returns quoted in this article reflect the market weighted average returns of stocks that currently trade on GB exchanges.
We aim to bring you long-term focused research analysis driven by fundamental data. Note that our analysis may not factor in the latest price-sensitive company announcements or qualitative material.
If you spot an error that warrants correction, please contact the editor at editorial-team@simplywallst.com. This article by Simply Wall St is general in nature. It does not constitute a recommendation to buy or sell any stock, and does not take account of your objectives, or your financial situation. Simply Wall St has no position in the stocks mentioned. Thank you for reading.
