
 Yahoo Finance
 A Look At The Fair Value Of Expro Group Holdings N.V. (NYSE:XPRO)
Key Insights
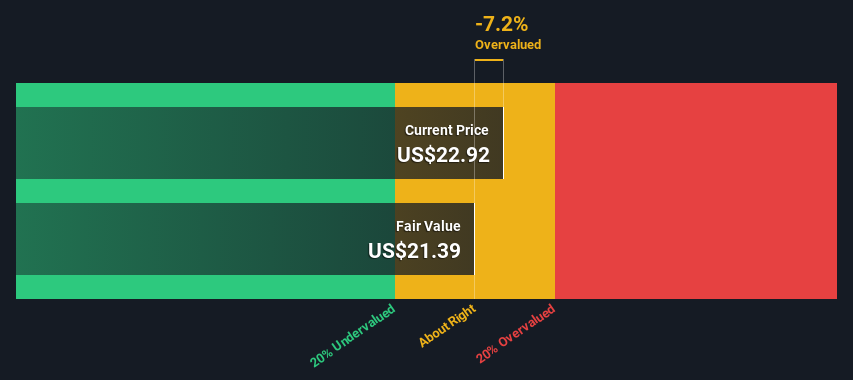
Expro Group Holdings' estimated fair value is US$21.39 based on 2 Stage Free Cash Flow to Equity
Current share price of US$22.92 suggests Expro Group Holdings is potentially trading close to its fair value
Analyst price target for XPRO is US$25.29, which is 18% above our fair value estimate
Does the June share price for Expro Group Holdings N.V. (NYSE:XPRO) reflect what it's really worth? Today, we will estimate the stock's intrinsic value by taking the expected future cash flows and discounting them to their present value. This will be done using the Discounted Cash Flow (DCF) model. Before you think you won't be able to understand it, just read on! It's actually much less complex than you'd imagine.
Remember though, that there are many ways to estimate a company's value, and a DCF is just one method. If you want to learn more about discounted cash flow, the rationale behind this calculation can be read in detail in the Simply Wall St analysis model.
Check out our latest analysis for Expro Group Holdings
Is Expro Group Holdings Fairly Valued?
We use what is known as a 2-stage model, which simply means we have two different periods of growth rates for the company's cash flows. Generally the first stage is higher growth, and the second stage is a lower growth phase. To begin with, we have to get estimates of the next ten years of cash flows. Where possible we use analyst estimates, but when these aren't available we extrapolate the previous free cash flow (FCF) from the last estimate or reported value. We assume companies with shrinking free cash flow will slow their rate of shrinkage, and that companies with growing free cash flow will see their growth rate slow, over this period. We do this to reflect that growth tends to slow more in the early years than it does in later years.
A DCF is all about the idea that a dollar in the future is less valuable than a dollar today, and so the sum of these future cash flows is then discounted to today's value:
10-year free cash flow (FCF) forecast
2024 | 2025 | 2026 | 2027 | 2028 | 2029 | 2030 | 2031 | 2032 | 2033 | |
Levered FCF ($, Millions) | US$144.5m | US$149.8m | US$123.1m | US$146.2m | US$164.2m | US$170.6m | US$176.4m | US$181.9m | US$187.2m | US$192.3m |
Growth Rate Estimate Source | Analyst x3 | Analyst x3 | Analyst x1 | Analyst x1 | Analyst x1 | Est @ 3.89% | Est @ 3.44% | Est @ 3.12% | Est @ 2.90% | Est @ 2.74% |
Present Value ($, Millions) Discounted @ 8.4% | US$133 | US$127 | US$96.7 | US$106 | US$110 | US$105 | US$100 | US$95.4 | US$90.6 | US$85.8 |
("Est" = FCF growth rate estimated by Simply Wall St)
Present Value of 10-year Cash Flow (PVCF) = US$1.1b
The second stage is also known as Terminal Value, this is the business's cash flow after the first stage. For a number of reasons a very conservative growth rate is used that cannot exceed that of a country's GDP growth. In this case we have used the 5-year average of the 10-year government bond yield (2.4%) to estimate future growth. In the same way as with the 10-year 'growth' period, we discount future cash flows to today's value, using a cost of equity of 8.4%.
Terminal Value (TV)= FCF2033 × (1 + g) ÷ (r – g) = US$192m× (1 + 2.4%) ÷ (8.4%– 2.4%) = US$3.3b
Present Value of Terminal Value (PVTV)= TV / (1 + r)10= US$3.3b÷ ( 1 + 8.4%)10= US$1.5b
The total value, or equity value, is then the sum of the present value of the future cash flows, which in this case is US$2.5b. The last step is to then divide the equity value by the number of shares outstanding. Compared to the current share price of US$22.9, the company appears around fair value at the time of writing. Remember though, that this is just an approximate valuation, and like any complex formula - garbage in, garbage out.
Important Assumptions
We would point out that the most important inputs to a discounted cash flow are the discount rate and of course the actual cash flows. If you don't agree with these result, have a go at the calculation yourself and play with the assumptions. The DCF also does not consider the possible cyclicality of an industry, or a company's future capital requirements, so it does not give a full picture of a company's potential performance. Given that we are looking at Expro Group Holdings as potential shareholders, the cost of equity is used as the discount rate, rather than the cost of capital (or weighted average cost of capital, WACC) which accounts for debt. In this calculation we've used 8.4%, which is based on a levered beta of 1.310. Beta is a measure of a stock's volatility, compared to the market as a whole. We get our beta from the industry average beta of globally comparable companies, with an imposed limit between 0.8 and 2.0, which is a reasonable range for a stable business.
SWOT Analysis for Expro Group Holdings
Strength
Debt is not viewed as a risk.
Weakness
Expensive based on P/S ratio and estimated fair value.
Shareholders have been diluted in the past year.
Opportunity
Expected to breakeven next year.
Has sufficient cash runway for more than 3 years based on current free cash flows.
Threat
No apparent threats visible for XPRO.
Looking Ahead:
Valuation is only one side of the coin in terms of building your investment thesis, and it shouldn't be the only metric you look at when researching a company. The DCF model is not a perfect stock valuation tool. Preferably you'd apply different cases and assumptions and see how they would impact the company's valuation. For instance, if the terminal value growth rate is adjusted slightly, it can dramatically alter the overall result. For Expro Group Holdings, there are three further elements you should assess:
Risks: To that end, you should be aware of the 2 warning signs we've spotted with Expro Group Holdings .
Management:Have insiders been ramping up their shares to take advantage of the market's sentiment for XPRO's future outlook? Check out our management and board analysis with insights on CEO compensation and governance factors.
Other High Quality Alternatives: Do you like a good all-rounder? Explore our interactive list of high quality stocks to get an idea of what else is out there you may be missing!
PS. Simply Wall St updates its DCF calculation for every American stock every day, so if you want to find the intrinsic value of any other stock just search here.
Have feedback on this article? Concerned about the content? Get in touch with us directly. Alternatively, email editorial-team (at) simplywallst.com.
This article by Simply Wall St is general in nature. We provide commentary based on historical data and analyst forecasts only using an unbiased methodology and our articles are not intended to be financial advice. It does not constitute a recommendation to buy or sell any stock, and does not take account of your objectives, or your financial situation. We aim to bring you long-term focused analysis driven by fundamental data. Note that our analysis may not factor in the latest price-sensitive company announcements or qualitative material. Simply Wall St has no position in any stocks mentioned.
Have feedback on this article? Concerned about the content? Get in touch with us directly. Alternatively, email editorial-team@simplywallst.com
