
 Yahoo Finance
 A Look At The Fair Value Of Tong Herr Resources Berhad (KLSE:TONGHER)
Key Insights
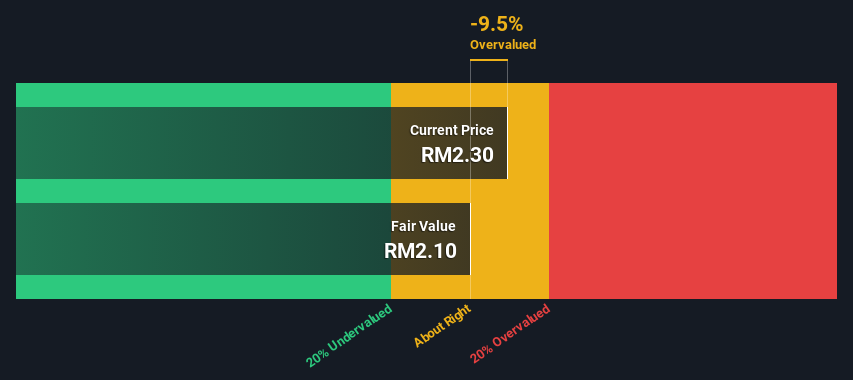
The projected fair value for Tong Herr Resources Berhad is RM2.10 based on 2 Stage Free Cash Flow to Equity
Current share price of RM2.30 suggests Tong Herr Resources Berhad is potentially trading close to its fair value
Industry average of 170% suggests Tong Herr Resources Berhad's peers are currently trading at a higher premium to fair value
In this article we are going to estimate the intrinsic value of Tong Herr Resources Berhad (KLSE:TONGHER) by projecting its future cash flows and then discounting them to today's value. We will use the Discounted Cash Flow (DCF) model on this occasion. Don't get put off by the jargon, the math behind it is actually quite straightforward.
Remember though, that there are many ways to estimate a company's value, and a DCF is just one method. Anyone interested in learning a bit more about intrinsic value should have a read of the Simply Wall St analysis model.
Check out our latest analysis for Tong Herr Resources Berhad
The Model
We are going to use a two-stage DCF model, which, as the name states, takes into account two stages of growth. The first stage is generally a higher growth period which levels off heading towards the terminal value, captured in the second 'steady growth' period. In the first stage we need to estimate the cash flows to the business over the next ten years. Seeing as no analyst estimates of free cash flow are available to us, we have extrapolate the previous free cash flow (FCF) from the company's last reported value. We assume companies with shrinking free cash flow will slow their rate of shrinkage, and that companies with growing free cash flow will see their growth rate slow, over this period. We do this to reflect that growth tends to slow more in the early years than it does in later years.
A DCF is all about the idea that a dollar in the future is less valuable than a dollar today, so we discount the value of these future cash flows to their estimated value in today's dollars:
10-year free cash flow (FCF) estimate
2024 | 2025 | 2026 | 2027 | 2028 | 2029 | 2030 | 2031 | 2032 | 2033 | |
Levered FCF (MYR, Millions) | RM43.2m | RM33.2m | RM28.2m | RM25.5m | RM24.1m | RM23.4m | RM23.2m | RM23.3m | RM23.6m | RM24.1m |
Growth Rate Estimate Source | Est @ -34.41% | Est @ -23.02% | Est @ -15.05% | Est @ -9.47% | Est @ -5.56% | Est @ -2.83% | Est @ -0.92% | Est @ 0.42% | Est @ 1.36% | Est @ 2.02% |
Present Value (MYR, Millions) Discounted @ 10% | RM39.2 | RM27.4 | RM21.2 | RM17.4 | RM14.9 | RM13.2 | RM11.9 | RM10.8 | RM10.0 | RM9.2 |
("Est" = FCF growth rate estimated by Simply Wall St)
Present Value of 10-year Cash Flow (PVCF) = RM175m
The second stage is also known as Terminal Value, this is the business's cash flow after the first stage. For a number of reasons a very conservative growth rate is used that cannot exceed that of a country's GDP growth. In this case we have used the 5-year average of the 10-year government bond yield (3.6%) to estimate future growth. In the same way as with the 10-year 'growth' period, we discount future cash flows to today's value, using a cost of equity of 10%.
Terminal Value (TV)= FCF2033 × (1 + g) ÷ (r – g) = RM24m× (1 + 3.6%) ÷ (10%– 3.6%) = RM384m
Present Value of Terminal Value (PVTV)= TV / (1 + r)10= RM384m÷ ( 1 + 10%)10= RM147m
The total value, or equity value, is then the sum of the present value of the future cash flows, which in this case is RM322m. The last step is to then divide the equity value by the number of shares outstanding. Relative to the current share price of RM2.3, the company appears around fair value at the time of writing. Valuations are imprecise instruments though, rather like a telescope - move a few degrees and end up in a different galaxy. Do keep this in mind.
Important Assumptions
The calculation above is very dependent on two assumptions. The first is the discount rate and the other is the cash flows. If you don't agree with these result, have a go at the calculation yourself and play with the assumptions. The DCF also does not consider the possible cyclicality of an industry, or a company's future capital requirements, so it does not give a full picture of a company's potential performance. Given that we are looking at Tong Herr Resources Berhad as potential shareholders, the cost of equity is used as the discount rate, rather than the cost of capital (or weighted average cost of capital, WACC) which accounts for debt. In this calculation we've used 10%, which is based on a levered beta of 1.025. Beta is a measure of a stock's volatility, compared to the market as a whole. We get our beta from the industry average beta of globally comparable companies, with an imposed limit between 0.8 and 2.0, which is a reasonable range for a stable business.
SWOT Analysis for Tong Herr Resources Berhad
Strength
Debt is well covered by cash flow.
Weakness
Earnings declined over the past year.
Interest payments on debt are not well covered.
Dividend is low compared to the top 25% of dividend payers in the Machinery market.
Current share price is above our estimate of fair value.
Opportunity
TONGHER's financial characteristics indicate limited near-term opportunities for shareholders.
Lack of analyst coverage makes it difficult to determine TONGHER's earnings prospects.
Threat
Dividends are not covered by earnings.
Next Steps:
Valuation is only one side of the coin in terms of building your investment thesis, and it ideally won't be the sole piece of analysis you scrutinize for a company. It's not possible to obtain a foolproof valuation with a DCF model. Instead the best use for a DCF model is to test certain assumptions and theories to see if they would lead to the company being undervalued or overvalued. If a company grows at a different rate, or if its cost of equity or risk free rate changes sharply, the output can look very different. For Tong Herr Resources Berhad, we've put together three further elements you should further examine:
Risks: To that end, you should be aware of the 3 warning signs we've spotted with Tong Herr Resources Berhad .
Other High Quality Alternatives: Do you like a good all-rounder? Explore our interactive list of high quality stocks to get an idea of what else is out there you may be missing!
Other Top Analyst Picks: Interested to see what the analysts are thinking? Take a look at our interactive list of analysts' top stock picks to find out what they feel might have an attractive future outlook!
PS. The Simply Wall St app conducts a discounted cash flow valuation for every stock on the KLSE every day. If you want to find the calculation for other stocks just search here.
Have feedback on this article? Concerned about the content? Get in touch with us directly. Alternatively, email editorial-team (at) simplywallst.com.
This article by Simply Wall St is general in nature. We provide commentary based on historical data and analyst forecasts only using an unbiased methodology and our articles are not intended to be financial advice. It does not constitute a recommendation to buy or sell any stock, and does not take account of your objectives, or your financial situation. We aim to bring you long-term focused analysis driven by fundamental data. Note that our analysis may not factor in the latest price-sensitive company announcements or qualitative material. Simply Wall St has no position in any stocks mentioned.
Have feedback on this article? Concerned about the content? Get in touch with us directly. Alternatively, email editorial-team@simplywallst.com
