
 Yahoo Finance
 A Look Into Robert Half International's (NYSE:RHI) Impressive Returns On Capital
If we want to find a stock that could multiply over the long term, what are the underlying trends we should look for? In a perfect world, we'd like to see a company investing more capital into its business and ideally the returns earned from that capital are also increasing. This shows us that it's a compounding machine, able to continually reinvest its earnings back into the business and generate higher returns. With that in mind, the ROCE of Robert Half International (NYSE:RHI) looks attractive right now, so lets see what the trend of returns can tell us.
What Is Return On Capital Employed (ROCE)?
Just to clarify if you're unsure, ROCE is a metric for evaluating how much pre-tax income (in percentage terms) a company earns on the capital invested in its business. To calculate this metric for Robert Half International, this is the formula:
Return on Capital Employed = Earnings Before Interest and Tax (EBIT) ÷ (Total Assets - Current Liabilities)
0.49 = US$855m ÷ (US$3.0b - US$1.2b) (Based on the trailing twelve months to March 2023).
So, Robert Half International has an ROCE of 49%. That's a fantastic return and not only that, it outpaces the average of 12% earned by companies in a similar industry.
See our latest analysis for Robert Half International
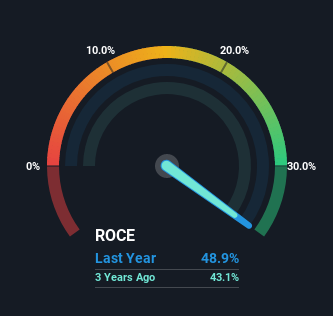
Above you can see how the current ROCE for Robert Half International compares to its prior returns on capital, but there's only so much you can tell from the past. If you're interested, you can view the analysts predictions in our free report on analyst forecasts for the company.
How Are Returns Trending?
In terms of Robert Half International's history of ROCE, it's quite impressive. Over the past five years, ROCE has remained relatively flat at around 49% and the business has deployed 56% more capital into its operations. With returns that high, it's great that the business can continually reinvest its money at such appealing rates of return. If Robert Half International can keep this up, we'd be very optimistic about its future.
Another thing to note, Robert Half International has a high ratio of current liabilities to total assets of 41%. This can bring about some risks because the company is basically operating with a rather large reliance on its suppliers or other sorts of short-term creditors. While it's not necessarily a bad thing, it can be beneficial if this ratio is lower.
Our Take On Robert Half International's ROCE
In the end, the company has proven it can reinvest it's capital at high rates of returns, which you'll remember is a trait of a multi-bagger. In light of this, the stock has only gained 21% over the last five years for shareholders who have owned the stock in this period. So because of the trends we're seeing, we'd recommend looking further into this stock to see if it has the makings of a multi-bagger.
On a final note, we've found 1 warning sign for Robert Half International that we think you should be aware of.
Robert Half International is not the only stock earning high returns. If you'd like to see more, check out our free list of companies earning high returns on equity with solid fundamentals.
Have feedback on this article? Concerned about the content? Get in touch with us directly. Alternatively, email editorial-team (at) simplywallst.com.
This article by Simply Wall St is general in nature. We provide commentary based on historical data and analyst forecasts only using an unbiased methodology and our articles are not intended to be financial advice. It does not constitute a recommendation to buy or sell any stock, and does not take account of your objectives, or your financial situation. We aim to bring you long-term focused analysis driven by fundamental data. Note that our analysis may not factor in the latest price-sensitive company announcements or qualitative material. Simply Wall St has no position in any stocks mentioned.
Join A Paid User Research Session
You’ll receive a US$30 Amazon Gift card for 1 hour of your time while helping us build better investing tools for the individual investors like yourself. Sign up here
