
 Yahoo Finance
 Lovesac's (LOVE) Shares Up on Narrower Than Expected Q1 Loss
The Lovesac Company LOVE reported better-than-expected results in first-quarter fiscal 2025 (ended May 5, 2024), with earnings and net sales beating the Zacks Consensus Estimate. However, on a year-over-year basis, net sales declined and the adjusted loss widened.
The quarter’s results reflect a 14.8% decline in omnichannel comparable net sales and a 9% decline in internet sales. This downtick was reflected in the soft contributions from the company’s reportable segments and was partially offset by the net addition of 35 new showrooms compared with the year-ago period.
Furthermore, an increase in outbound transportation and warehousing costs accompanied by a rise in overhead expenses, payroll, rent and selling-related expenses marred the bottom line.
Nonetheless, going forward, the company aims to focus on its omnichannel infinity flywheel, which has been designed for the life platform and advantaged supply chain. The omnichannel infinity flywheel is expected to deliver outperforming results and capitalize on the market opportunities.
Following the earnings release, Lovesac’s shares gained 1.1% during trading hours on Jun 13.
Inside the Numbers
In the fiscal first quarter, the company reported an adjusted loss of 83 cents per share, narrower than the Zacks Consensus Estimate of loss of 99 cents per share. Lovesac reported an adjusted loss per share of 28 cents in the prior-year quarter.
The Lovesac Company Price, Consensus and EPS Surprise
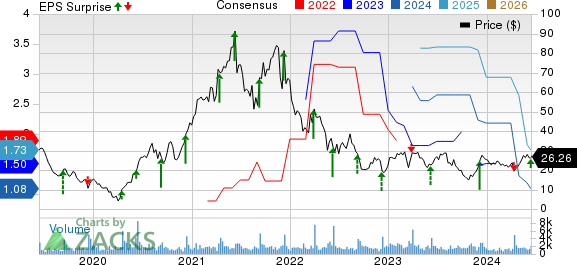
The Lovesac Company price-consensus-eps-surprise-chart | The Lovesac Company Quote
Net sales of $132.6 million topped the consensus estimate of $128 million by 3.5%. The metric, however, declined 6.1% from the year-ago quarter’s figure.
Operating Highlights
The gross margin expanded 430 basis points (bps) year over year to 54.3%, mainly driven by a decrease of 790 bps in inbound transportation costs. This was partially offset by an increase of 240 bps in outbound transportation and warehousing costs and a decrease of 120 bps in product margin driven by higher promotional discounting.
Selling, general and administrative expenses, as a percentage of net sales, increased notably 1,160 bps to 51.6% year over year. Advertising & marketing expenses, as a percentage of net sales, rose 160 bps year over year to 13.6%.
Adjusted EBITDA was $(10.3) million compared with $(2.1) million reported a year ago.
Financial Highlights
As of May 5, Lovesac had cash and cash equivalents of $72.4 million compared with $87 million at the end of fiscal 2024.
Net cash used in operating activities totaled $7 million as of the first quarter fiscal 2025 end against net cash provided of $6.3 million reported in the year-ago comparable period.
Q2 Guidance
For the second quarter of fiscal 2025, Lovesac expects net sales to be in the range of $152-$160 million and adjusted EBITDA loss in the range of $2- $5 million. In second-quarter fiscal 2024, it reported net sales of $154.5 million and an adjusted EBITDA of $5.3 million.
The company expects net loss to be in the range of $6-$8 million. In the year-ago period, it reported a net loss of $0.6 million.
Fiscal 2025 Guidance Retained
For fiscal 2025, the company expects net sales to be in the range of $700-$770 million.
Adjusted EBITDA is expected to be in the range of $46-$60 million. Net income is expected to be in the band of $18-$27 million.
Diluted income per common share is expected to be in the band of $1.06- $1.59 on approximately 17 million estimated diluted weighted average shares outstanding.
Zacks Rank & Key Picks
Lovesac currently carries a Zacks Rank #5 (Strong Sell).
Here are some better-ranked stocks from the Zacks Retail-Wholesale sector.
Wingstop Inc. WING currently sports a Zacks Rank #1 (Strong Buy). You can see the complete list of today’s Zacks Rank #1 stocks here.
WING has a trailing four-quarter earnings surprise of 21.4%, on average. The stock has risen 115.3% in the past year. The Zacks Consensus Estimate for WING’s 2024 sales and earnings per share (EPS) indicates growth of 27.5% and 36.7%, respectively, from the year-ago period’s levels.
Sprouts Farmers Market, Inc. SFM currently sports a Zacks Rank of 1. SFM has a trailing four-quarter earnings surprise of 9.2%, on average. The stock has hiked 117.4% in the past year.
The consensus estimate for SFM’s 2024 sales and EPS indicates growth of 8% and 9.9%, respectively, from the year-ago period’s levels.
The Gap, Inc. GPS currently sports a Zacks Rank of 1. GPS has a trailing four-quarter earnings surprise of 202.7%, on average. The stock has surged 166.2% in the past year.
The Zacks Consensus Estimate for GPS’ fiscal 2024 sales and EPS indicates a rise of 0.1% and 17.5%, respectively, from the year-ago period’s levels.
Want the latest recommendations from Zacks Investment Research? Today, you can download 7 Best Stocks for the Next 30 Days. Click to get this free report
The Gap, Inc. (GPS) : Free Stock Analysis Report
Sprouts Farmers Market, Inc. (SFM) : Free Stock Analysis Report
Wingstop Inc. (WING) : Free Stock Analysis Report
The Lovesac Company (LOVE) : Free Stock Analysis Report
