
 Yahoo Finance
 Macfarlane Group's (LON:MACF) investors will be pleased with their respectable 39% return over the last five years
When we invest, we're generally looking for stocks that outperform the market average. And while active stock picking involves risks (and requires diversification) it can also provide excess returns. For example, the Macfarlane Group PLC (LON:MACF) share price is up 24% in the last 5 years, clearly besting the market return of around 5.8% (ignoring dividends). However, more recent returns haven't been as impressive as that, with the stock returning just 13% in the last year, including dividends.
Now it's worth having a look at the company's fundamentals too, because that will help us determine if the long term shareholder return has matched the performance of the underlying business.
View our latest analysis for Macfarlane Group
There is no denying that markets are sometimes efficient, but prices do not always reflect underlying business performance. By comparing earnings per share (EPS) and share price changes over time, we can get a feel for how investor attitudes to a company have morphed over time.
During five years of share price growth, Macfarlane Group achieved compound earnings per share (EPS) growth of 11% per year. The EPS growth is more impressive than the yearly share price gain of 4% over the same period. So one could conclude that the broader market has become more cautious towards the stock.
You can see below how EPS has changed over time (discover the exact values by clicking on the image).
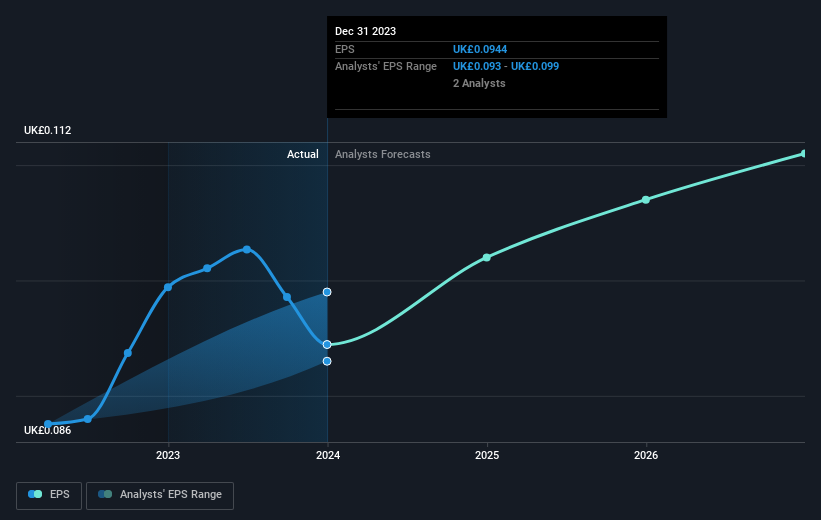
Dive deeper into Macfarlane Group's key metrics by checking this interactive graph of Macfarlane Group's earnings, revenue and cash flow.
What About Dividends?
As well as measuring the share price return, investors should also consider the total shareholder return (TSR). The TSR incorporates the value of any spin-offs or discounted capital raisings, along with any dividends, based on the assumption that the dividends are reinvested. So for companies that pay a generous dividend, the TSR is often a lot higher than the share price return. In the case of Macfarlane Group, it has a TSR of 39% for the last 5 years. That exceeds its share price return that we previously mentioned. The dividends paid by the company have thusly boosted the total shareholder return.
A Different Perspective
It's nice to see that Macfarlane Group shareholders have received a total shareholder return of 13% over the last year. And that does include the dividend. That's better than the annualised return of 7% over half a decade, implying that the company is doing better recently. Given the share price momentum remains strong, it might be worth taking a closer look at the stock, lest you miss an opportunity. While it is well worth considering the different impacts that market conditions can have on the share price, there are other factors that are even more important. Even so, be aware that Macfarlane Group is showing 2 warning signs in our investment analysis , you should know about...
For those who like to find winning investments this free list of undervalued companies with recent insider purchasing, could be just the ticket.
Please note, the market returns quoted in this article reflect the market weighted average returns of stocks that currently trade on British exchanges.
Have feedback on this article? Concerned about the content? Get in touch with us directly. Alternatively, email editorial-team (at) simplywallst.com.
This article by Simply Wall St is general in nature. We provide commentary based on historical data and analyst forecasts only using an unbiased methodology and our articles are not intended to be financial advice. It does not constitute a recommendation to buy or sell any stock, and does not take account of your objectives, or your financial situation. We aim to bring you long-term focused analysis driven by fundamental data. Note that our analysis may not factor in the latest price-sensitive company announcements or qualitative material. Simply Wall St has no position in any stocks mentioned.
