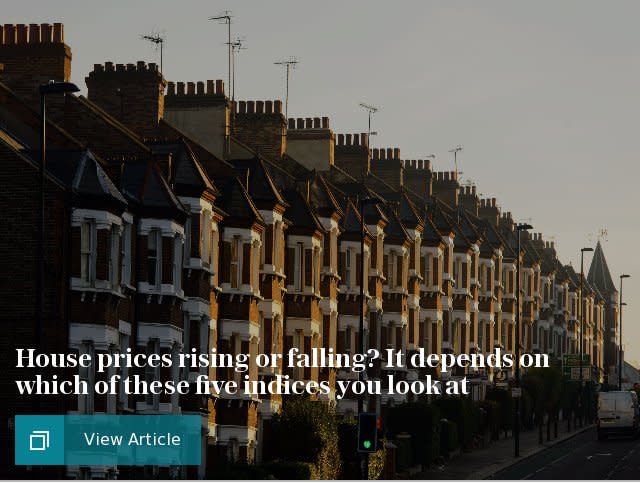
London house prices fall for the first time in eight years - but northern cities soar

House prices in London have registered their first annual decline in eight years, making the capital the worst-performing region in Britain – a position it last held in 2005.
The data, published today by lender Nationwide Building Society, showed a "marked slowdown" in London while the rest of the country saw prices continue to rise.
While price growth in the capital has been falling for some time, these are the first of Nationwide's figures to reveal an actual fall since the onset of the financial crisis.
London's average prices fell 0.6pc in the year to September, compared to the national average growth of 2pc.
A north-south divide is emerging, Nationwide said, with growth in the West and East Midlands, Yorkshire and the north exceeding growth in southern counties.
This picture was confirmed by separate data from house price analysts Hometrack, which shows house price growth in Manchester, Birmingham and Edinburgh soaring ahead while the capital drags down overall growth.
Manchester recorded annual house price growth of 7.3pc, Hometrack said, as falling unemployment and record low mortgage rates continue to support demand. Birmingham's rate of growth was 6.7pc and Edinburgh was at 6.6pc.
According to Hometrack, the capital's price growth rate is 1.9pc.
Richard Donnell, head of research at Hometrack, said this was a "pattern [which is expected] to remain a feature of the market for the rest of the year and into 2018”.
He added that "the upward momentum in house price growth across regional cities shows no sign of slowing".
The average annual growth in house prices across the UK's 20 biggest cities slowed to 4.9pc in August, compared to 6.6pc in last year. But after a lull in the first half of the year, the three-month price growth has rallied slightly, with prices up 2.5pc between June and August, compared to the three months previously.

Hometrack also calculated that the total value of property in the biggest 20 UK cities has now exceeded £3 trillion, representing 43pc of the total value of the UK's housing market.
It also found that in these cities, there was £610bn of outstanding mortgage debt secured against the value of housing, equal to 20pc of the total value.


 Yahoo Finance