
 Yahoo Finance
 Many Would Be Envious Of Renishaw's (LON:RSW) Excellent Returns On Capital
There are a few key trends to look for if we want to identify the next multi-bagger. Ideally, a business will show two trends; firstly a growing return on capital employed (ROCE) and secondly, an increasing amount of capital employed. Basically this means that a company has profitable initiatives that it can continue to reinvest in, which is a trait of a compounding machine. Ergo, when we looked at the ROCE trends at Renishaw (LON:RSW), we liked what we saw.
What is Return On Capital Employed (ROCE)?
For those who don't know, ROCE is a measure of a company's yearly pre-tax profit (its return), relative to the capital employed in the business. To calculate this metric for Renishaw, this is the formula:
Return on Capital Employed = Earnings Before Interest and Tax (EBIT) ÷ (Total Assets - Current Liabilities)
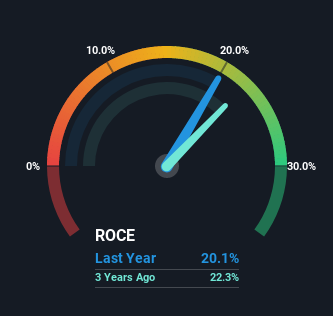
0.20 = UK£156m ÷ (UK£881m - UK£103m) (Based on the trailing twelve months to December 2021).
Thus, Renishaw has an ROCE of 20%. That's a fantastic return and not only that, it outpaces the average of 12% earned by companies in a similar industry.
View our latest analysis for Renishaw
Above you can see how the current ROCE for Renishaw compares to its prior returns on capital, but there's only so much you can tell from the past. If you'd like to see what analysts are forecasting going forward, you should check out our free report for Renishaw.
What The Trend Of ROCE Can Tell Us
Renishaw deserves to be commended in regards to it's returns. The company has consistently earned 20% for the last five years, and the capital employed within the business has risen 50% in that time. With returns that high, it's great that the business can continually reinvest its money at such appealing rates of return. If Renishaw can keep this up, we'd be very optimistic about its future.
What We Can Learn From Renishaw's ROCE
Renishaw has demonstrated its proficiency by generating high returns on increasing amounts of capital employed, which we're thrilled about. And given the stock has only risen 17% over the last five years, we'd suspect the market is beginning to recognize these trends. So to determine if Renishaw is a multi-bagger going forward, we'd suggest digging deeper into the company's other fundamentals.
While Renishaw looks impressive, no company is worth an infinite price. The intrinsic value infographic in our free research report helps visualize whether RSW is currently trading for a fair price.
High returns are a key ingredient to strong performance, so check out our free list ofstocks earning high returns on equity with solid balance sheets.
Have feedback on this article? Concerned about the content? Get in touch with us directly. Alternatively, email editorial-team (at) simplywallst.com.
This article by Simply Wall St is general in nature. We provide commentary based on historical data and analyst forecasts only using an unbiased methodology and our articles are not intended to be financial advice. It does not constitute a recommendation to buy or sell any stock, and does not take account of your objectives, or your financial situation. We aim to bring you long-term focused analysis driven by fundamental data. Note that our analysis may not factor in the latest price-sensitive company announcements or qualitative material. Simply Wall St has no position in any stocks mentioned.