
 Yahoo Finance
 The Market Doesn't Like What It Sees From Gulf & Pacific Equities Corp.'s (CVE:GUF) Earnings Yet
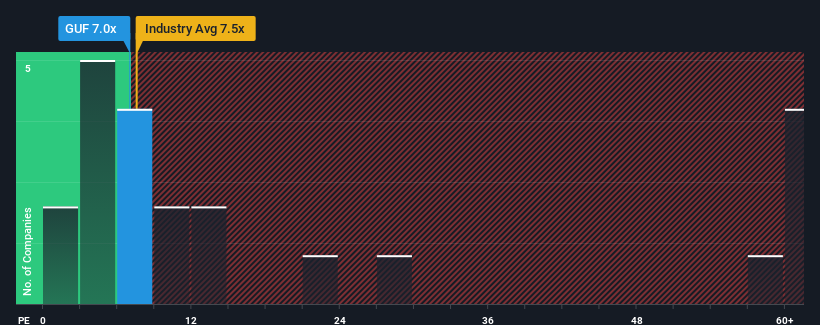
With a price-to-earnings (or "P/E") ratio of 7x Gulf & Pacific Equities Corp. (CVE:GUF) may be sending bullish signals at the moment, given that almost half of all companies in Canada have P/E ratios greater than 12x and even P/E's higher than 26x are not unusual. Nonetheless, we'd need to dig a little deeper to determine if there is a rational basis for the reduced P/E.
For instance, Gulf & Pacific Equities' receding earnings in recent times would have to be some food for thought. One possibility is that the P/E is low because investors think the company won't do enough to avoid underperforming the broader market in the near future. If you like the company, you'd be hoping this isn't the case so that you could potentially pick up some stock while it's out of favour.
See our latest analysis for Gulf & Pacific Equities
Want the full picture on earnings, revenue and cash flow for the company? Then our free report on Gulf & Pacific Equities will help you shine a light on its historical performance.
Is There Any Growth For Gulf & Pacific Equities?
In order to justify its P/E ratio, Gulf & Pacific Equities would need to produce sluggish growth that's trailing the market.
Taking a look back first, the company's earnings per share growth last year wasn't something to get excited about as it posted a disappointing decline of 61%. At least EPS has managed not to go completely backwards from three years ago in aggregate, thanks to the earlier period of growth. Therefore, it's fair to say that earnings growth has been inconsistent recently for the company.
This is in contrast to the rest of the market, which is expected to grow by 11% over the next year, materially higher than the company's recent medium-term annualised growth rates.
With this information, we can see why Gulf & Pacific Equities is trading at a P/E lower than the market. Apparently many shareholders weren't comfortable holding on to something they believe will continue to trail the bourse.
The Key Takeaway
Generally, our preference is to limit the use of the price-to-earnings ratio to establishing what the market thinks about the overall health of a company.
We've established that Gulf & Pacific Equities maintains its low P/E on the weakness of its recent three-year growth being lower than the wider market forecast, as expected. At this stage investors feel the potential for an improvement in earnings isn't great enough to justify a higher P/E ratio. Unless the recent medium-term conditions improve, they will continue to form a barrier for the share price around these levels.
It is also worth noting that we have found 6 warning signs for Gulf & Pacific Equities (3 make us uncomfortable!) that you need to take into consideration.
If P/E ratios interest you, you may wish to see this free collection of other companies with strong earnings growth and low P/E ratios.
Have feedback on this article? Concerned about the content? Get in touch with us directly. Alternatively, email editorial-team (at) simplywallst.com.
This article by Simply Wall St is general in nature. We provide commentary based on historical data and analyst forecasts only using an unbiased methodology and our articles are not intended to be financial advice. It does not constitute a recommendation to buy or sell any stock, and does not take account of your objectives, or your financial situation. We aim to bring you long-term focused analysis driven by fundamental data. Note that our analysis may not factor in the latest price-sensitive company announcements or qualitative material. Simply Wall St has no position in any stocks mentioned.
Join A Paid User Research Session
You’ll receive a US$30 Amazon Gift card for 1 hour of your time while helping us build better investing tools for the individual investors like yourself. Sign up here
