
 Yahoo Finance
 Meta Platforms (NASDAQ:META) Is Reinvesting To Multiply In Value
If you're looking for a multi-bagger, there's a few things to keep an eye out for. Amongst other things, we'll want to see two things; firstly, a growing return on capital employed (ROCE) and secondly, an expansion in the company's amount of capital employed. If you see this, it typically means it's a company with a great business model and plenty of profitable reinvestment opportunities. Ergo, when we looked at the ROCE trends at Meta Platforms (NASDAQ:META), we liked what we saw.
Return On Capital Employed (ROCE): What Is It?
For those who don't know, ROCE is a measure of a company's yearly pre-tax profit (its return), relative to the capital employed in the business. Analysts use this formula to calculate it for Meta Platforms:
Return on Capital Employed = Earnings Before Interest and Tax (EBIT) ÷ (Total Assets - Current Liabilities)
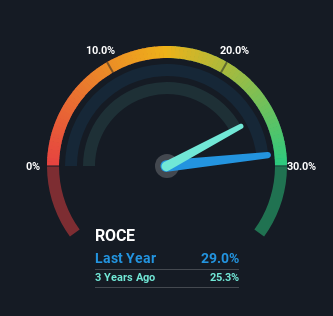
0.29 = US$56b ÷ (US$223b - US$28b) (Based on the trailing twelve months to March 2024).
Thus, Meta Platforms has an ROCE of 29%. That's a fantastic return and not only that, it outpaces the average of 6.4% earned by companies in a similar industry.
Check out our latest analysis for Meta Platforms
Above you can see how the current ROCE for Meta Platforms compares to its prior returns on capital, but there's only so much you can tell from the past. If you'd like to see what analysts are forecasting going forward, you should check out our free analyst report for Meta Platforms .
So How Is Meta Platforms' ROCE Trending?
We'd be pretty happy with returns on capital like Meta Platforms. The company has employed 96% more capital in the last five years, and the returns on that capital have remained stable at 29%. With returns that high, it's great that the business can continually reinvest its money at such appealing rates of return. If these trends can continue, it wouldn't surprise us if the company became a multi-bagger.
The Bottom Line On Meta Platforms' ROCE
In short, we'd argue Meta Platforms has the makings of a multi-bagger since its been able to compound its capital at very profitable rates of return. On top of that, the stock has rewarded shareholders with a remarkable 167% return to those who've held over the last five years. So while the positive underlying trends may be accounted for by investors, we still think this stock is worth looking into further.
Like most companies, Meta Platforms does come with some risks, and we've found 1 warning sign that you should be aware of.
If you'd like to see other companies earning high returns, check out our free list of companies earning high returns with solid balance sheets here.
Have feedback on this article? Concerned about the content? Get in touch with us directly. Alternatively, email editorial-team (at) simplywallst.com.
This article by Simply Wall St is general in nature. We provide commentary based on historical data and analyst forecasts only using an unbiased methodology and our articles are not intended to be financial advice. It does not constitute a recommendation to buy or sell any stock, and does not take account of your objectives, or your financial situation. We aim to bring you long-term focused analysis driven by fundamental data. Note that our analysis may not factor in the latest price-sensitive company announcements or qualitative material. Simply Wall St has no position in any stocks mentioned.
Have feedback on this article? Concerned about the content? Get in touch with us directly. Alternatively, email editorial-team@simplywallst.com
