
 Yahoo Finance
 How Much Did PageGroup plc's (LON:PAGE) CEO Pocket Last Year?

In 2006 Steve Ingham was appointed CEO of PageGroup plc (LON:PAGE). This analysis aims first to contrast CEO compensation with other companies that have similar market capitalization. After that, we will consider the growth in the business. Third, we'll reflect on the total return to shareholders over three years, as a second measure of business performance. This process should give us an idea about how appropriately the CEO is paid.
Check out our latest analysis for PageGroup
How Does Steve Ingham's Compensation Compare With Similar Sized Companies?
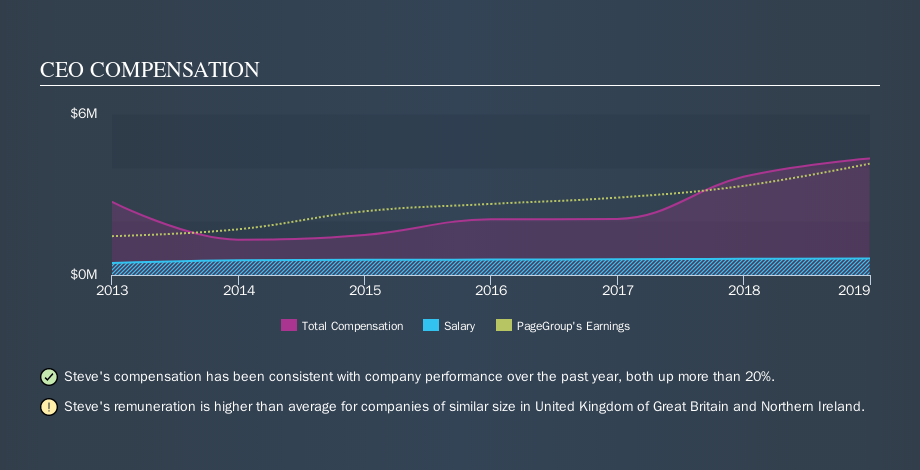
Our data indicates that PageGroup plc is worth UK£1.5b, and total annual CEO compensation was reported as UK£4.3m for the year to December 2018. While we always look at total compensation first, we note that the salary component is less, at UK£616k. We note that more than half of the total compensation is not the salary; and performance requirements may apply to this non-salary portion. As part of our analysis we looked at companies in the same jurisdiction, with market capitalizations of UK£771m to UK£2.5b. The median total CEO compensation was UK£1.4m.
As you can see, Steve Ingham is paid more than the median CEO pay at companies of a similar size, in the same market. However, this does not necessarily mean PageGroup plc is paying too much. A closer look at the performance of the underlying business will give us a better idea about whether the pay is particularly generous.
The graphic below shows how CEO compensation at PageGroup has changed from year to year.
Is PageGroup plc Growing?
On average over the last three years, PageGroup plc has grown earnings per share (EPS) by 14% each year (using a line of best fit). Its revenue is up 12% over last year.
This shows that the company has improved itself over the last few years. Good news for shareholders. It's also good to see decent revenue growth in the last year, suggesting the business is healthy and growing. Shareholders might be interested in this free visualization of analyst forecasts.
Has PageGroup plc Been A Good Investment?
Most shareholders would probably be pleased with PageGroup plc for providing a total return of 45% over three years. This strong performance might mean some shareholders don't mind if the CEO were to be paid more than is normal for a company of its size.
In Summary...
We compared the total CEO remuneration paid by PageGroup plc, and compared it to remuneration at a group of similar sized companies. We found that it pays well over the median amount paid in the benchmark group.
However, the earnings per share growth over three years is certainly impressive. In addition, shareholders have done well over the same time period. So, considering this good performance, the CEO compensation may be quite appropriate. So you may want to check if insiders are buying PageGroup shares with their own money (free access).
Important note: PageGroup may not be the best stock to buy. You might find something better in this list of interesting companies with high ROE and low debt.
We aim to bring you long-term focused research analysis driven by fundamental data. Note that our analysis may not factor in the latest price-sensitive company announcements or qualitative material.
If you spot an error that warrants correction, please contact the editor at editorial-team@simplywallst.com. This article by Simply Wall St is general in nature. It does not constitute a recommendation to buy or sell any stock, and does not take account of your objectives, or your financial situation. Simply Wall St has no position in the stocks mentioned. Thank you for reading.
