
 Yahoo Finance
 Murphy Oil (NYSE:MUR) delivers shareholders strong 39% CAGR over 3 years, surging 3.3% in the last week alone
The worst result, after buying shares in a company (assuming no leverage), would be if you lose all the money you put in. But in contrast you can make much more than 100% if the company does well. To wit, the Murphy Oil Corporation (NYSE:MUR) share price has flown 150% in the last three years. That sort of return is as solid as granite. It's also up 11% in about a month. We note that Murphy Oil reported its financial results recently; luckily, you can catch up on the latest revenue and profit numbers in our company report.
The past week has proven to be lucrative for Murphy Oil investors, so let's see if fundamentals drove the company's three-year performance.
View our latest analysis for Murphy Oil
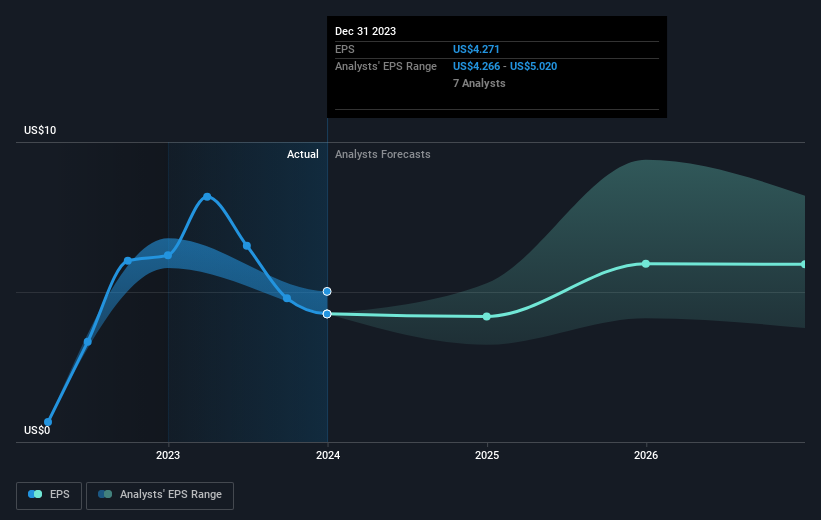
In his essay The Superinvestors of Graham-and-Doddsville Warren Buffett described how share prices do not always rationally reflect the value of a business. One flawed but reasonable way to assess how sentiment around a company has changed is to compare the earnings per share (EPS) with the share price.
Murphy Oil became profitable within the last three years. That kind of transition can be an inflection point that justifies a strong share price gain, just as we have seen here.
The company's earnings per share (over time) is depicted in the image below (click to see the exact numbers).
We know that Murphy Oil has improved its bottom line over the last three years, but what does the future have in store? This free interactive report on Murphy Oil's balance sheet strength is a great place to start, if you want to investigate the stock further.
What About Dividends?
When looking at investment returns, it is important to consider the difference between total shareholder return (TSR) and share price return. Whereas the share price return only reflects the change in the share price, the TSR includes the value of dividends (assuming they were reinvested) and the benefit of any discounted capital raising or spin-off. So for companies that pay a generous dividend, the TSR is often a lot higher than the share price return. We note that for Murphy Oil the TSR over the last 3 years was 169%, which is better than the share price return mentioned above. And there's no prize for guessing that the dividend payments largely explain the divergence!
A Different Perspective
Murphy Oil's TSR for the year was broadly in line with the market average, at 28%. Most would be happy with a gain, and it helps that the year's return is actually better than the average return over five years, which was 12%. Even if the share price growth slows down from here, there's a good chance that this is business worth watching in the long term. It's always interesting to track share price performance over the longer term. But to understand Murphy Oil better, we need to consider many other factors. To that end, you should be aware of the 2 warning signs we've spotted with Murphy Oil .
If you like to buy stocks alongside management, then you might just love this free list of companies. (Hint: insiders have been buying them).
Please note, the market returns quoted in this article reflect the market weighted average returns of stocks that currently trade on American exchanges.
Have feedback on this article? Concerned about the content? Get in touch with us directly. Alternatively, email editorial-team (at) simplywallst.com.
This article by Simply Wall St is general in nature. We provide commentary based on historical data and analyst forecasts only using an unbiased methodology and our articles are not intended to be financial advice. It does not constitute a recommendation to buy or sell any stock, and does not take account of your objectives, or your financial situation. We aim to bring you long-term focused analysis driven by fundamental data. Note that our analysis may not factor in the latest price-sensitive company announcements or qualitative material. Simply Wall St has no position in any stocks mentioned.
