
 Yahoo Finance
 Should National Express Group PLC’s (LON:NEX) Weak Investment Returns Worry You?

Today we are going to look at National Express Group PLC (LON:NEX) to see whether it might be an attractive investment prospect. Specifically, we’re going to calculate its Return On Capital Employed (ROCE), in the hopes of getting some insight into the business.
Firstly, we’ll go over how we calculate ROCE. Then we’ll compare its ROCE to similar companies. Then we’ll determine how its current liabilities are affecting its ROCE.
What is Return On Capital Employed (ROCE)?
ROCE measures the amount of pre-tax profits a company can generate from the capital employed in its business. Generally speaking a higher ROCE is better. Overall, it is a valuable metric that has its flaws. Author Edwin Whiting says to be careful when comparing the ROCE of different businesses, since ‘No two businesses are exactly alike.’
So, How Do We Calculate ROCE?
The formula for calculating the return on capital employed is:
Return on Capital Employed = Earnings Before Interest and Tax (EBIT) ÷ (Total Assets – Current Liabilities)
Or for National Express Group:
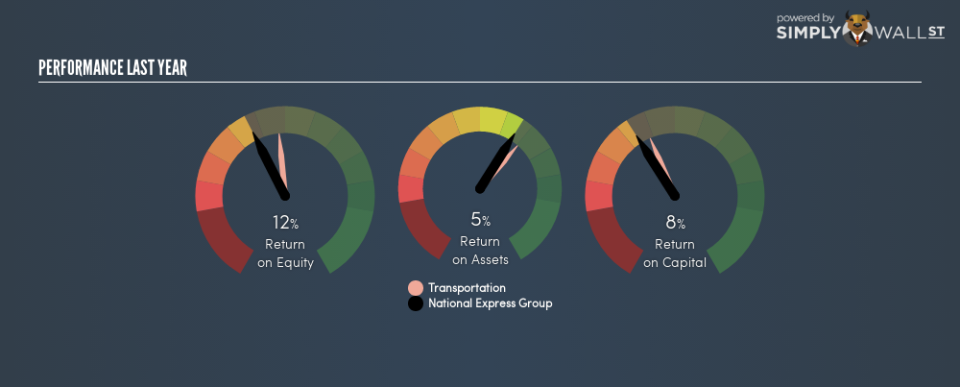
0.081 = UK£196m ÷ (UK£3.4b – UK£951m) (Based on the trailing twelve months to June 2018.)
So, National Express Group has an ROCE of 8.1%.
See our latest analysis for National Express Group
Want to participate in a short research study? Help shape the future of investing tools and receive a $60 prize!
Does National Express Group Have A Good ROCE?
ROCE can be useful when making comparisons, such as between similar companies. Using our data, National Express Group’s ROCE appears to be significantly below the 13% average in the Transportation industry. This performance is not ideal, as it suggests the company may not be deploying its capital as effectively as some competitors. Separate from how National Express Group stacks up against its industry, its ROCE in absolute terms is mediocre; relative to the returns on government bonds. Readers may find more attractive investment prospects elsewhere.
Remember that this metric is backwards looking – it shows what has happened in the past, and does not accurately predict the future. ROCE can be misleading for companies in cyclical industries, with returns looking impressive during the boom times, but very weak during the busts. ROCE is, after all, simply a snap shot of a single year. What happens in the future is pretty important for investors, so we have prepared a free report on analyst forecasts for National Express Group.
What Are Current Liabilities, And How Do They Affect National Express Group’s ROCE?
Short term (or current) liabilities, are things like supplier invoices, overdrafts, or tax bills that need to be paid within 12 months. Due to the way ROCE is calculated, a high level of current liabilities makes a company look as though it has less capital employed, and thus can (sometimes unfairly) boost the ROCE. To counteract this, we check if a company has high current liabilities, relative to its total assets.
National Express Group has total liabilities of UK£951m and total assets of UK£3.4b. As a result, its current liabilities are equal to approximately 28% of its total assets. It is good to see a restrained amount of current liabilities, as this limits the effect on ROCE.
What We Can Learn From National Express Group’s ROCE
With that in mind, we’re not overly impressed with National Express Group’s ROCE, so it may not be the most appealing prospect. You might be able to find a better buy than National Express Group. If you want a selection of possible winners, check out this free list of interesting companies that trade on a P/E below 20 (but have proven they can grow earnings).
For those who like to find winning investments this free list of growing companies with recent insider purchasing, could be just the ticket.
To help readers see past the short term volatility of the financial market, we aim to bring you a long-term focused research analysis purely driven by fundamental data. Note that our analysis does not factor in the latest price-sensitive company announcements.
The author is an independent contributor and at the time of publication had no position in the stocks mentioned. For errors that warrant correction please contact the editor at editorial-team@simplywallst.com.
