
 Yahoo Finance
 NetLink NBN Trust (SGX:CJLU) Is Doing The Right Things To Multiply Its Share Price
If we want to find a potential multi-bagger, often there are underlying trends that can provide clues. One common approach is to try and find a company with returns on capital employed (ROCE) that are increasing, in conjunction with a growing amount of capital employed. Put simply, these types of businesses are compounding machines, meaning they are continually reinvesting their earnings at ever-higher rates of return. So when we looked at NetLink NBN Trust (SGX:CJLU) and its trend of ROCE, we really liked what we saw.
Return On Capital Employed (ROCE): What Is It?
Just to clarify if you're unsure, ROCE is a metric for evaluating how much pre-tax income (in percentage terms) a company earns on the capital invested in its business. Analysts use this formula to calculate it for NetLink NBN Trust:
Return on Capital Employed = Earnings Before Interest and Tax (EBIT) ÷ (Total Assets - Current Liabilities)
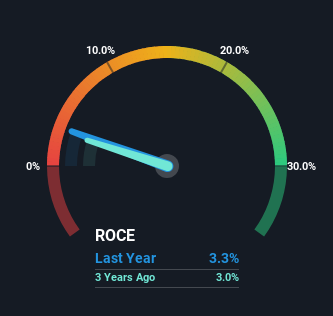
0.033 = S$126m ÷ (S$3.9b - S$137m) (Based on the trailing twelve months to March 2024).
Therefore, NetLink NBN Trust has an ROCE of 3.3%. In absolute terms, that's a low return and it also under-performs the Telecom industry average of 11%.
Check out our latest analysis for NetLink NBN Trust
Above you can see how the current ROCE for NetLink NBN Trust compares to its prior returns on capital, but there's only so much you can tell from the past. If you're interested, you can view the analysts predictions in our free analyst report for NetLink NBN Trust .
The Trend Of ROCE
Even though ROCE is still low in absolute terms, it's good to see it's heading in the right direction. Looking at the data, we can see that even though capital employed in the business has remained relatively flat, the ROCE generated has risen by 56% over the last five years. Basically the business is generating higher returns from the same amount of capital and that is proof that there are improvements in the company's efficiencies. On that front, things are looking good so it's worth exploring what management has said about growth plans going forward.
The Key Takeaway
To sum it up, NetLink NBN Trust is collecting higher returns from the same amount of capital, and that's impressive. Investors may not be impressed by the favorable underlying trends yet because over the last five years the stock has only returned 29% to shareholders. Given that, we'd look further into this stock in case it has more traits that could make it multiply in the long term.
On a separate note, we've found 1 warning sign for NetLink NBN Trust you'll probably want to know about.
While NetLink NBN Trust isn't earning the highest return, check out this free list of companies that are earning high returns on equity with solid balance sheets.
Have feedback on this article? Concerned about the content? Get in touch with us directly. Alternatively, email editorial-team (at) simplywallst.com.
This article by Simply Wall St is general in nature. We provide commentary based on historical data and analyst forecasts only using an unbiased methodology and our articles are not intended to be financial advice. It does not constitute a recommendation to buy or sell any stock, and does not take account of your objectives, or your financial situation. We aim to bring you long-term focused analysis driven by fundamental data. Note that our analysis may not factor in the latest price-sensitive company announcements or qualitative material. Simply Wall St has no position in any stocks mentioned.
