
 Yahoo Finance
 NETSOL Technologies Reports 14% Revenue Growth and EPS of $0.03 in Fiscal Third Quarter 2024

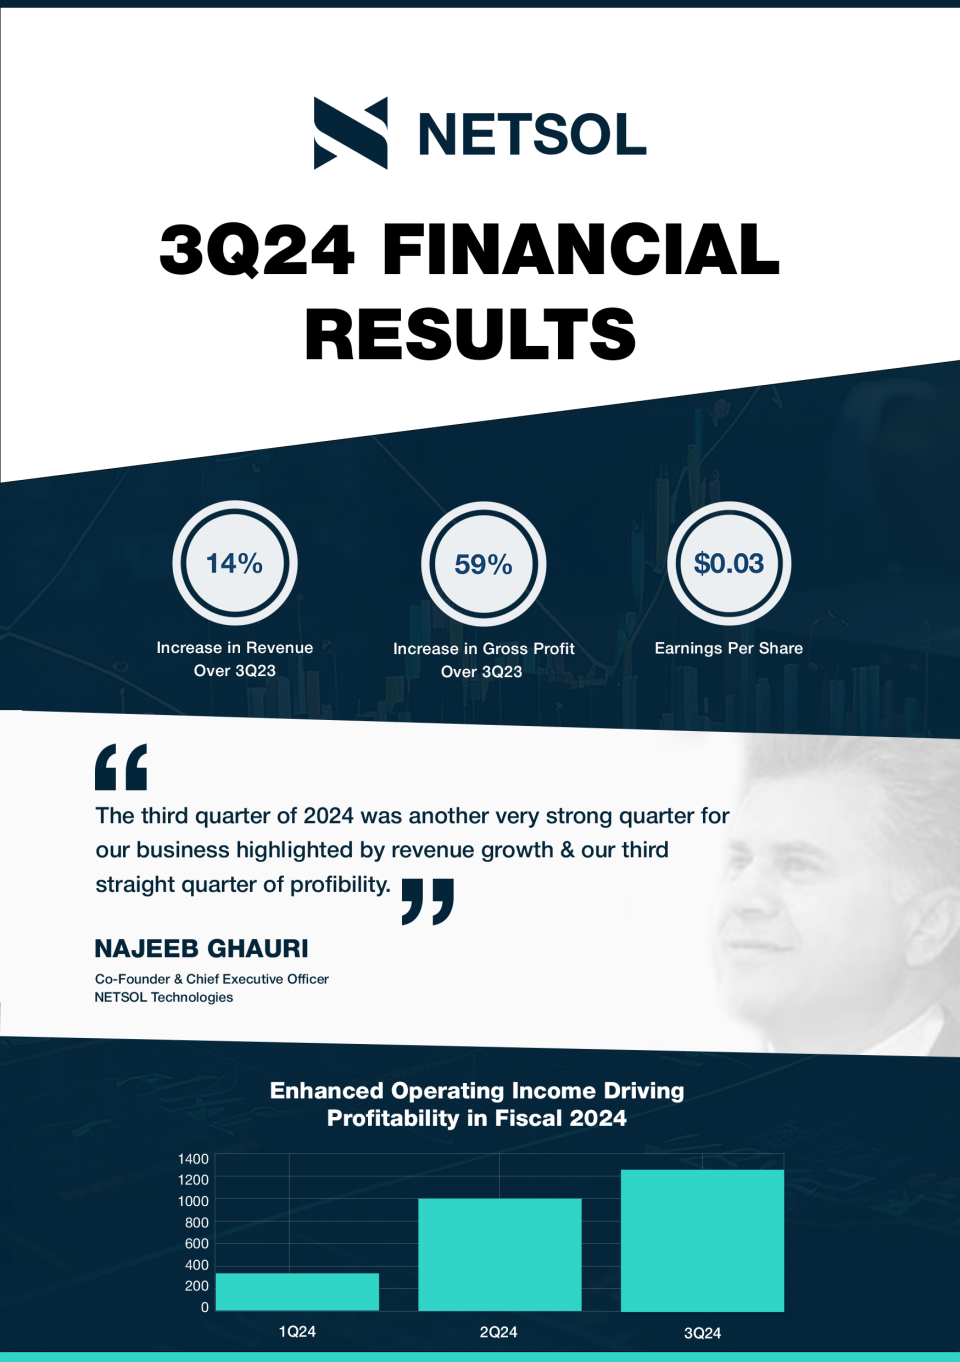
14% increase in Total Revenues to $15.5 million in 3Q ‘24
60% increase in 3Q ‘24 Services Revenues to $7.8 million compared to 3Q ‘23
3Q ‘24 Gross Margins of 48% increased from 35% in 3Q ’23
Third consecutive quarter of profitability
On pace to meet target revenue range of $60 - $61 million for FY ‘24
Targeting FY ’24 Subscription and Support Revenue of $28 million
Establish AI integration as major company wide initiative
ENCINO, Calif., May 20, 2024 (GLOBE NEWSWIRE) -- NETSOL Technologies, Inc. (Nasdaq: NTWK), a global business services and asset finance solutions provider, reported results for the third quarter and nine months of fiscal 2024 ended March 31, 2024.
Najeeb Ghauri, Co-Founder and Chief Executive Officer of NETSOL Technologies, commented, “The third quarter of 2024 was another very strong quarter for our business highlighted by revenue growth and our third straight quarter of profitability. We demonstrated NETSOL’s ability to deliver profitable results without the recognition of significant license fees, showcasing the enhanced strength and reliability of our model as we continue to win new customers on a global scale.”
Fiscal Third Quarter 2024 Financial Results
Total net revenues for the third quarter of fiscal 2024 increased 14% to $15.5 million, compared with $13.5 million in the prior year period. On a constant currency basis, total net revenues were $15.6 million.
License fees were $558,000 compared with $2.0 million in the prior year period. License fees on a constant currency basis were $577,000.
Total subscription (SaaS and Cloud) and support revenues were $7.1 million compared with $6.7 million in the prior year period. Total subscription and support revenues on a constant currency basis were $7.2 million.
Total services revenues were $7.8 million, compared with $4.9 million in the prior year period. Total services revenues on a constant currency basis were $7.8 million.
Gross profit for the third quarter of fiscal 2024 was $7.5 million or 48% of net revenues, compared to $4.7 million or 35% of net revenues in the third quarter of fiscal 2023. On a constant currency basis, gross profit for the third quarter of fiscal 2024 was $7.2 million or 46% of net revenues as measured on a constant currency basis.
Operating expenses for the third quarter of fiscal 2024 were $6.2 million or 40% of sales compared to $5.6 million or 42% of sales for the third quarter of fiscal 2023. On a constant currency basis, operating expenses for the third quarter of fiscal 2024 increased to $6.3 million or 41% of sales on a constant currency basis.
GAAP net income attributable to NETSOL for the third quarter of fiscal 2024 totaled $328,000 or $0.03 per diluted share, compared with a GAAP net income of $2.5 million or $0.23 per diluted share in the third quarter of fiscal 2023. Included in GAAP net income attributable to NETSOL was a loss of $(964,000) on foreign currency exchange transactions in the third quarter of fiscal 2024, compared to a gain of $5.4 million in the prior year period. As most contracts are either in U.S. dollars or Euros, currency fluctuations will yield foreign currency exchange gains or losses depending on the value of other currencies compared to the U.S. dollar and the Euro. On a constant currency basis, GAAP net loss attributable to NETSOL for the third quarter of fiscal 2024 totaled $(35,000) or $(0.003) per diluted share.
Non-GAAP adjusted EBITDA for the third quarter of fiscal 2024 was $810,000 or $0.07 per diluted share, compared with non-GAAP adjusted EBITDA of $3.3 million or $0.29 per diluted share in the third quarter of fiscal 2023 (see note regarding “Use of Non-GAAP Financial Measures,” below for further discussion of this non-GAAP measure).
Nine Months Ended March 31, 2024 Financial Results
Total net revenues for the nine months ended March 31, 2024, were $44.9 million, compared to $38.6 million in the prior year period. On a constant currency basis, total net revenues were $45.2 million.
License fees were $4.8 million compared with $2.2 million in the prior year period. License fees on a constant currency basis were $4.9 million.
Total subscription (SaaS and Cloud) and support revenues for the nine months ended March 31, 2024, were $20.5 million compared with $19.2 million in the prior year period. Total subscription and support revenues on a constant currency basis were $20.5 million.
Total services revenues were $19.6 million compared with $17.2 million in the prior year period. Total services revenues on a constant currency basis were $19.8 million.
Gross profit for the nine months ended March 31, 2024, was $20.8 million or 46% of net revenues, compared with $12.1 million or 31% of net revenues in the prior year period. On a constant currency basis, gross profit for the nine months ended March 31, 2024, was $17.8 million or 39% of net revenues as measured on a constant currency basis.
Operating expenses for the nine months ended March 31, 2024, were $18.1 million or 40% of sales compared with $18.0 million or 47% of sales in the prior year period. On a constant currency basis, operating expenses for the nine months ended March 31, 2024, were $19.5 million or 43% of sales on a constant currency basis.
GAAP net income attributable to NETSOL for the nine months ended March 31, 2024, totaled $767,000 or $0.07 per diluted share, compared with a GAAP net loss of $(169,000) or $(0.01) per diluted share in the prior year period. Included in GAAP net income attributable to NETSOL was a loss of $(1.1 million) on foreign currency exchange transactions for the nine months ended March 31, 2024, compared to a gain of $7.4 million in the prior year period. On a constant currency basis, GAAP net loss attributable to NETSOL for the first nine months of fiscal 2024 totaled $(2.4 million) or $(0.21) per diluted share.
Non-GAAP adjusted EBITDA for the nine months ended March 31, 2024, was $2.0 million or $0.18 per diluted share, compared with non-GAAP adjusted EBITDA of $1.9 million or $0.17 per diluted share in the prior year period (see note regarding “Use of Non-GAAP Financial Measures,” below for further discussion of this non-GAAP measure).
At March 31, 2024, cash and cash equivalents were $12.3 million. Total NETSOL stockholders’ equity at March 31, 2024, was $35.3 million, or $3.10 per share.
Management Commentary
“These past several quarters have showcased our hybrid license and SaaS model at work,” Mr. Ghauri stated. “We recognized substantial license fees in the first half of fiscal 2024, and these contracts are now generating services revenues for our business with services revenues in the third quarter of fiscal 2024 increasing approximately 60% compared to the third quarter of fiscal 2023. We have a strong sales pipeline of licensing and SaaS opportunities in our established markets and are working diligently to expand our pipeline in the United States. As we continue to win new contracts, we expect to realize both license fees and services revenues on a more consistent basis which, based on our recent performance, we believe will drive enhanced profitability for our business.
“We continue to make progress advancing our initiatives in the U.S. market,” Mr. Ghauri continued. “We’re expanding our pipeline of opportunities in this region and remain committed to hiring the best talent available. We’re intently focused on the continuous innovation and improvement of our offerings to meet the diverse demands of our customers, and we’re integrating leading technology including deep learning AI algorithms.
“To that end, we have launched a company wide AI initiative to reduce internal costs and enhance external quality improvements. We have nearly three decades of internal program management data, which we intend to use to train our AI use cases. We are also in the process of creating industry leading AI use cases for our clients to help improve their business metrics with an anticipated launch of several new AI-based offerings in the calendar year.
“We’re very pleased with our performance in both the third quarter and the fiscal year to date and are beginning to realize the strength of our business model as we drive revenue growth and consistent profitability. Looking ahead, we’re encouraged by our pipeline of license and SaaS deals in our established markets, and we’re committed to allocating capital to our many growth opportunities, specifically the United States. Given our results, we remain confident in our expectation of double-digit organic revenue growth and improved margins and are on pace to reach our target revenue range of between $60 million and $61 million for the full year of 2024,” Mr. Ghauri concluded.
Conference Call
NETSOL Technologies management will hold a conference call today (May 20, 2024) at 9:00 a.m. Eastern Time (6:00 a.m. Pacific Time) to discuss these financial results. A question-and-answer session will follow management's presentation.
U.S. dial-in: 800-343-4849
International dial-in: 203-518-9848
Please call the conference telephone number 5-10 minutes prior to the start time and provide the operator with the conference ID: NETSOL. The operator will register your name and organization. If you have any difficulty connecting with the conference call, please contact Investor Relations at 818-222-9195.
The conference call will also be broadcast live and available for replay here, along with additional replay access being provided through the company information section of NETSOL’s website.
A telephone replay of the conference call will be available approximately three hours after the call concludes through Monday, June 3, 2024.
Toll-free replay number: 844-512-2921
International replay number: 412-317-6671
Replay ID: 11155702
About NETSOL Technologies
NETSOL Technologies, Inc. (Nasdaq: NTWK) is a worldwide provider of IT and enterprise software solutions primarily serving the global leasing and finance industry. The Company’s suite of applications is backed by 40 years of domain expertise and supported by a committed team of professionals placed in ten strategically located support and delivery centers throughout the world. NETSOL’s products help companies transform their finance and leasing operations, providing a fully automated asset-based finance solution covering the complete leasing and finance lifecycle.
Forward-Looking Statements
This press release may contain forward-looking statements relating to the development of the Company's products and services and future operation results, including statements regarding the Company that are subject to certain risks and uncertainties that could cause actual results to differ materially from those projected. The words “expects,” “anticipates,” variations of such words, and similar expressions, identify forward-looking statements within the meaning of the Private Securities Litigation Reform Act of 1995, but their absence does not mean that the statement is not forward-looking. These statements are not guarantees of future performance and are subject to certain risks, uncertainties, and assumptions that are difficult to predict. Factors that could affect the Company's actual results include the progress and costs of the development of products and services and the timing of the market acceptance. The subject Companies expressly disclaim any obligation or undertaking to update or revise any forward-looking statement contained herein to reflect any change in the company's expectations with regard thereto or any change in events, conditions or circumstances upon which any statement is based.
Use of Non-GAAP Financial Measures
The reconciliation of Adjusted EBITDA to net income, the most comparable financial measure based upon GAAP, as well as a further explanation of adjusted EBITDA, is included in the financial tables in Schedule 4 of this press release.
Investor Relations Contact:
IMS Investor Relations
netsol@imsinvestorrelations.com
+1 203-972-9200
NETSOL Technologies, Inc. and Subsidiaries | |||||||||
|
|
|
|
|
| ||||
|
|
| As of |
| As of | ||||
| ASSETS | March 31, 2024 |
| June 30, 2023 | |||||
Current assets: |
|
|
| ||||||
| Cash and cash equivalents | $ | 12,338,642 |
|
| $ | 15,533,254 |
| |
| Accounts receivable, net of allowance of $414,745 and $420,354 |
| 15,826,210 |
|
|
| 11,714,422 |
| |
| Revenues in excess of billings, net of allowance of $116,023 and $1,380,141 |
| 15,659,806 |
|
|
| 12,377,677 |
| |
| Other current assets |
| 2,398,403 |
|
|
| 1,978,514 |
| |
|
| Total current assets |
| 46,223,061 |
|
|
| 41,603,867 |
|
Revenues in excess of billings, net - long term |
| 752,582 |
|
|
| - |
| ||
Property and equipment, net |
| 5,505,609 |
|
|
| 6,161,186 |
| ||
Right of use assets - operating leases |
| 1,490,669 |
|
|
| 1,151,575 |
| ||
Other assets |
| 32,341 |
|
|
| 32,327 |
| ||
Intangible assets, net |
| - |
|
|
| 127,931 |
| ||
Goodwill |
| 9,302,524 |
|
|
| 9,302,524 |
| ||
|
| Total assets | $ | 63,306,786 |
|
| $ | 58,379,410 |
|
|
|
|
|
|
| ||||
| LIABILITIES AND STOCKHOLDERS' EQUITY |
|
|
| |||||
Current liabilities: |
|
|
| ||||||
| Accounts payable and accrued expenses | $ | 6,707,937 |
|
| $ | 6,552,181 |
| |
| Current portion of loans and obligations under finance leases |
| 6,047,511 |
|
|
| 5,779,510 |
| |
| Current portion of operating lease obligations |
| 635,168 |
|
|
| 505,237 |
| |
| Unearned revenue |
| 9,503,548 |
|
|
| 7,932,306 |
| |
|
| Total current liabilities |
| 22,894,164 |
|
|
| 20,769,234 |
|
Loans and obligations under finance leases; less current maturities |
| 130,381 |
|
|
| 176,229 |
| ||
Operating lease obligations; less current maturities |
| 837,756 |
|
|
| 652,194 |
| ||
|
| Total liabilities |
| 23,862,301 |
|
|
| 21,597,657 |
|
|
|
|
|
|
| ||||
Stockholders' equity: |
|
|
| ||||||
| Preferred stock, $.01 par value; 500,000 shares authorized; |
| - |
|
|
| - |
| |
| Common stock, $.01 par value; 14,500,000 shares authorized; |
|
|
| |||||
|
| 12,344,271 shares issued and 11,405,240 outstanding as of March 31, 2024, |
|
|
| ||||
|
| 12,284,887 shares issued and 11,345,856 outstanding as of June 30, 2023 |
| 123,445 |
|
|
| 122,850 |
|
| Additional paid-in-capital |
| 128,736,328 |
|
|
| 128,476,048 |
| |
| Treasury stock (at cost, 939,031 shares as of March 31, 2024 and June 30, 2023) |
| (3,920,856 | ) |
|
| (3,920,856 | ) | |
| Accumulated deficit |
| (44,129,431 | ) |
|
| (44,896,186 | ) | |
| Other comprehensive loss |
| (45,505,920 | ) |
|
| (45,975,156 | ) | |
|
| Total NetSol stockholders' equity |
| 35,303,566 |
|
|
| 33,806,700 |
|
| Non-controlling interest |
| 4,140,919 |
|
|
| 2,975,053 |
| |
|
| Total stockholders' equity |
| 39,444,485 |
|
|
| 36,781,753 |
|
|
| Total liabilities and stockholders' equity | $ | 63,306,786 |
|
| $ | 58,379,410 |
|
NETSOL Technologies, Inc. and Subsidiaries | |||||||||||||||||
|
|
|
|
| |||||||||||||
|
|
| For the Three Months | For the Nine Months | |||||||||||||
|
|
| Ended March 31, | Ended March 31, | |||||||||||||
|
|
|
| 2024 |
|
|
| 2023 |
|
|
| 2024 |
|
|
| 2023 |
|
Net Revenues: |
|
|
|
|
|
|
| ||||||||||
| License fees | $ | 558,340 |
|
| $ | 1,982,985 |
|
| $ | 4,829,242 |
|
| $ | 2,248,829 |
| |
| Subscription and support |
| 7,140,358 |
|
|
| 6,656,082 |
|
|
| 20,480,382 |
|
|
| 19,175,585 |
| |
| Services |
| 7,765,818 |
|
|
| 4,867,322 |
|
|
| 19,635,014 |
|
|
| 17,178,452 |
| |
|
| Total net revenues |
| 15,464,516 |
|
|
| 13,506,389 |
|
|
| 44,944,638 |
|
|
| 38,602,866 |
|
|
|
|
|
|
|
|
|
|
| ||||||||
Cost of revenues |
| 7,989,696 |
|
|
| 8,801,360 |
|
|
| 24,132,064 |
|
|
| 26,503,377 |
| ||
Gross profit |
| 7,474,820 |
|
|
| 4,705,029 |
|
|
| 20,812,574 |
|
|
| 12,099,489 |
| ||
Operating expenses: |
|
|
|
|
|
|
| ||||||||||
| Selling, general and administrative |
| 5,811,335 |
|
|
| 5,333,202 |
|
|
| 17,051,798 |
|
|
| 16,727,836 |
| |
| Research and development cost |
| 345,582 |
|
|
| 302,262 |
|
|
| 1,065,412 |
|
|
| 1,244,793 |
| |
|
| Total operating expenses |
| 6,156,917 |
|
|
| 5,635,464 |
|
|
| 18,117,210 |
|
|
| 17,972,629 |
|
|
|
|
|
|
|
|
|
|
| ||||||||
Income (loss) from operations |
| 1,317,903 |
|
|
| (930,435 | ) |
|
| 2,695,364 |
|
|
| (5,873,140 | ) | ||
Other income and (expenses) |
|
|
|
|
|
|
| ||||||||||
| Interest expense |
| (289,677 | ) |
|
| (188,137 | ) |
|
| (856,016 | ) |
|
| (512,110 | ) | |
| Interest income |
| 376,466 |
|
|
| 263,794 |
|
|
| 1,259,464 |
|
|
| 1,005,557 |
| |
| Gain (loss) on foreign currency exchange transactions |
| (963,887 | ) |
|
| 5,385,591 |
|
|
| (1,112,757 | ) |
|
| 7,358,519 |
| |
| Share of net loss from equity investment |
| - |
|
|
| 2,377 |
|
|
| - |
|
|
| 7,510 |
| |
| Other income (expense) |
| 21,634 |
|
|
| (62,941 | ) |
|
| 22,210 |
|
|
| 57,383 |
| |
|
| Total other income (expenses) |
| (855,464 | ) |
|
| 5,400,684 |
|
|
| (687,099 | ) |
|
| 7,916,859 |
|
|
|
|
|
|
|
|
|
|
| ||||||||
Net income before income taxes |
| 462,439 |
|
|
| 4,470,249 |
|
|
| 2,008,265 |
|
|
| 2,043,719 |
| ||
Income tax provision |
| (146,569 | ) |
|
| (227,718 | ) |
|
| (418,517 | ) |
|
| (641,122 | ) | ||
Net income |
| 315,870 |
|
|
| 4,242,531 |
|
|
| 1,589,748 |
|
|
| 1,402,597 |
| ||
| Non-controlling interest |
| 11,679 |
|
|
| (1,697,908 | ) |
|
| (822,993 | ) |
|
| (1,571,629 | ) | |
Net income (loss) attributable to NetSol | $ | 327,549 |
|
| $ | 2,544,623 |
|
| $ | 766,755 |
|
| $ | (169,032 | ) | ||
|
|
|
|
|
|
|
|
|
| ||||||||
|
|
|
|
|
|
|
|
|
| ||||||||
Net income (loss) per share: |
|
|
|
|
|
|
| ||||||||||
| Net income (loss) per common share |
|
|
|
|
|
|
| |||||||||
|
| Basic | $ | 0.03 |
|
| $ | 0.23 |
|
| $ | 0.07 |
|
| $ | (0.01 | ) |
|
| Diluted | $ | 0.03 |
|
| $ | 0.23 |
|
| $ | 0.07 |
|
| $ | (0.01 | ) |
|
|
|
|
|
|
|
|
|
| ||||||||
Weighted average number of shares outstanding |
|
|
|
|
|
|
| ||||||||||
| Basic |
| 11,390,888 |
|
|
| 11,283,954 |
|
|
| 11,369,778 |
|
|
| 11,270,466 |
| |
| Diluted |
| 11,430,493 |
|
|
| 11,283,954 |
|
|
| 11,409,383 |
|
|
| 11,270,466 |
| |
NETSOL Technologies, Inc. and Subsidiaries | ||||||||||
|
|
|
|
| ||||||
|
|
|
| For the Nine Months | ||||||
|
|
|
| Ended March 31, | ||||||
|
|
|
|
| 2024 |
|
|
| 2023 |
|
Cash flows from operating activities: |
|
|
| |||||||
| Net income | $ | 1,589,748 |
|
| $ | 1,402,597 |
| ||
| Adjustments to reconcile net income to net cash |
|
|
| ||||||
|
| provided by (used in) operating activities: |
|
|
| |||||
| Depreciation and amortization |
| 1,351,239 |
|
|
| 2,519,469 |
| ||
| Provision for bad debts |
| 9,739 |
|
|
| 7,648 |
| ||
| Share of net (gain) loss from investment under equity method |
| - |
|
|
| (7,510 | ) | ||
| (Gain) loss on sale of assets |
| (1,154 | ) |
|
| 56,494 |
| ||
| Stock based compensation |
| 260,875 |
|
|
| 198,559 |
| ||
| Changes in operating assets and liabilities: |
|
|
| ||||||
|
| Accounts receivable |
| (3,922,773 | ) |
|
| (1,855,899 | ) | |
|
| Revenues in excess of billing |
| (3,904,609 | ) |
|
| 240,324 |
| |
|
| Other current assets |
| (1,525 | ) |
|
| (621,731 | ) | |
|
| Accounts payable and accrued expenses |
| 77,541 |
|
|
| 1,321,289 |
| |
|
| Unearned revenue |
| 938,242 |
|
|
| (696,621 | ) | |
| Net cash provided by (used in) operating activities |
| (3,602,677 | ) |
|
| 2,564,619 |
| ||
|
|
|
|
|
|
| ||||
Cash flows from investing activities: |
|
|
| |||||||
| Purchases of property and equipment |
| (948,337 | ) |
|
| (1,575,059 | ) | ||
| Sales of property and equipment |
| 125,886 |
|
|
| 153,402 |
| ||
| Net cash used in investing activities |
| (822,451 | ) |
|
| (1,421,657 | ) | ||
|
|
|
|
|
|
| ||||
Cash flows from financing activities: |
|
|
| |||||||
| Proceeds from bank loans |
| 340,847 |
|
|
| 270,292 |
| ||
| Payments on finance lease obligations and loans - net |
| (307,235 | ) |
|
| (787,641 | ) | ||
| Net cash provided by (used in) financing activities |
| 33,612 |
|
|
| (517,349 | ) | ||
Effect of exchange rate changes |
| 1,196,904 |
|
|
| (9,329,913 | ) | |||
Net decrease in cash and cash equivalents |
| (3,194,612 | ) |
|
| (8,704,300 | ) | |||
Cash and cash equivalents at beginning of the period |
| 15,533,254 |
|
|
| 23,963,797 |
| |||
Cash and cash equivalents at end of period | $ | 12,338,642 |
|
| $ | 15,259,497 |
| |||
NETSOL Technologies, Inc. and Subsidiaries | |||||||||||||||
| For the Three Months |
| For the Nine Months | ||||||||||||
| Ended March 31, |
| Ended March 31, | ||||||||||||
|
| 2024 |
|
|
| 2023 |
|
|
| 2024 |
|
|
| 2023 |
|
|
|
|
|
|
|
|
| ||||||||
Net Income (loss) attributable to NetSol | $ | 327,549 |
|
| $ | 2,544,623 |
|
| $ | 766,755 |
|
| $ | (169,032 | ) |
Non-controlling interest |
| (11,679 | ) |
|
| 1,697,908 |
|
|
| 822,993 |
|
|
| 1,571,629 |
|
Income taxes |
| 146,569 |
|
|
| 227,718 |
|
|
| 418,517 |
|
|
| 641,122 |
|
Depreciation and amortization |
| 391,290 |
|
|
| 782,966 |
|
|
| 1,351,239 |
|
|
| 2,519,469 |
|
Interest expense |
| 289,677 |
|
|
| 188,137 |
|
|
| 856,016 |
|
|
| 512,110 |
|
Interest (income) |
| (376,466 | ) |
|
| (263,794 | ) |
|
| (1,259,464 | ) |
|
| (1,005,557 | ) |
EBITDA | $ | 766,940 |
|
| $ | 5,177,558 |
|
| $ | 2,956,056 |
|
| $ | 4,069,741 |
|
Add back: |
|
|
|
|
|
|
| ||||||||
Non-cash stock-based compensation |
| 149,088 |
|
|
| 52,392 |
|
|
| 260,875 |
|
|
| 198,559 |
|
Adjusted EBITDA, gross | $ | 916,028 |
|
| $ | 5,229,950 |
|
| $ | 3,216,931 |
|
| $ | 4,268,300 |
|
Less non-controlling interest (a) |
| (106,463 | ) |
|
| (1,971,602 | ) |
|
| (1,216,040 | ) |
|
| (2,363,774 | ) |
Adjusted EBITDA, net | $ | 809,565 |
|
| $ | 3,258,348 |
|
| $ | 2,000,891 |
|
| $ | 1,904,526 |
|
|
|
|
|
|
|
|
| ||||||||
Weighted Average number of shares outstanding |
|
|
|
|
|
|
| ||||||||
Basic |
| 11,390,888 |
|
|
| 11,283,954 |
|
|
| 11,369,778 |
|
|
| 11,270,466 |
|
Diluted |
| 11,430,493 |
|
|
| 11,283,954 |
|
|
| 11,409,383 |
|
|
| 11,270,466 |
|
|
|
|
|
|
|
|
| ||||||||
Basic adjusted EBITDA | $ | 0.07 |
|
| $ | 0.29 |
|
| $ | 0.18 |
|
| $ | 0.17 |
|
Diluted adjusted EBITDA | $ | 0.07 |
|
| $ | 0.29 |
|
| $ | 0.18 |
|
| $ | 0.17 |
|
|
|
|
|
|
|
|
| ||||||||
|
|
|
|
|
|
|
| ||||||||
(a)The reconciliation of adjusted EBITDA of non-controlling interest to net income attributable to non-controlling interest is as follows |
|
|
|
|
|
|
| ||||||||
|
|
|
|
|
|
|
| ||||||||
Net Income (loss) attributable to non-controlling interest | $ | (11,679 | ) |
| $ | 1,697,908 |
|
| $ | 822,993 |
|
| $ | 1,571,629 |
|
Income Taxes |
| 43,852 |
|
|
| 70,033 |
|
|
| 155,636 |
|
|
| 198,349 |
|
Depreciation and amortization |
| 97,010 |
|
|
| 219,759 |
|
|
| 348,092 |
|
|
| 713,676 |
|
Interest expense |
| 89,738 |
|
|
| 57,797 |
|
|
| 266,922 |
|
|
| 157,929 |
|
Interest (income) |
| (115,021 | ) |
|
| (77,988 | ) |
|
| (387,690 | ) |
|
| (303,489 | ) |
EBITDA | $ | 103,900 |
|
| $ | 1,967,509 |
|
| $ | 1,205,953 |
|
| $ | 2,338,094 |
|
Add back: |
|
|
|
|
|
|
| ||||||||
Non-cash stock-based compensation |
| 2,563 |
|
|
| 4,093 |
|
|
| 10,087 |
|
|
| 25,680 |
|
Adjusted EBITDA of non-controlling interest | $ | 106,463 |
|
| $ | 1,971,602 |
|
| $ | 1,216,040 |
|
| $ | 2,363,774 |
|
| |||||||||||||||
A photo accompanying this announcement is available at https://www.globenewswire.com/NewsRoom/AttachmentNg/c489814a-b61e-41e3-a892-4156277383c3

