
 Yahoo Finance
 Has Neways Electronics International N.V. (AMS:NEWAY) Improved Earnings Growth In Recent Times?

Understanding Neways Electronics International N.V.'s (ENXTAM:NEWAY) performance as a company requires examining more than earnings from one point in time. Today I will take you through a basic sense check to gain perspective on how Neways Electronics International is doing by evaluating its latest earnings with its longer term trend as well as its industry peers' performance over the same period.
See our latest analysis for Neways Electronics International
Did NEWAY beat its long-term earnings growth trend and its industry?
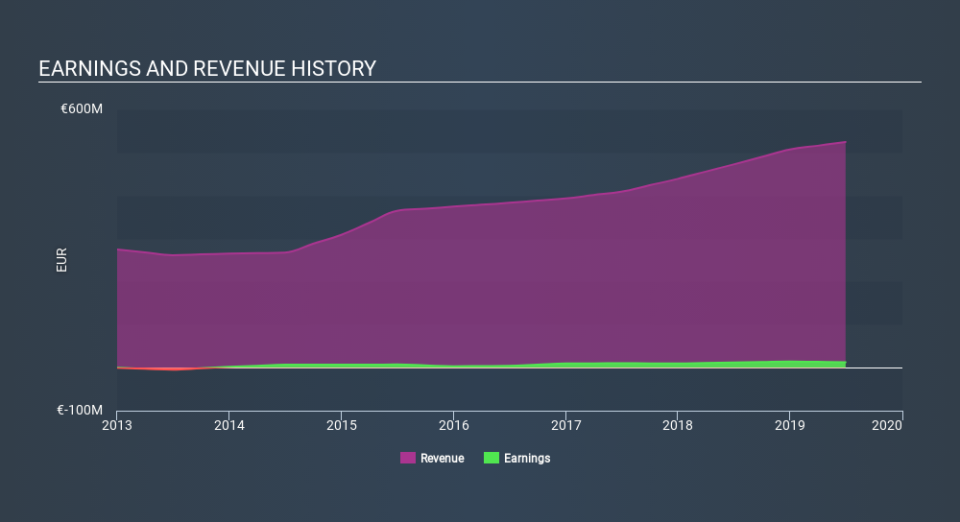
NEWAY's trailing twelve-month earnings (from 30 June 2019) of €13m has increased by 7.7% compared to the previous year.
However, this one-year growth rate has been lower than its average earnings growth rate over the past 5 years of 20%, indicating the rate at which NEWAY is growing has slowed down. Why could this be happening? Well, let’s take a look at what’s occurring with margins and whether the rest of the industry is facing the same headwind.
In terms of returns from investment, Neways Electronics International has fallen short of achieving a 20% return on equity (ROE), recording 12% instead. Furthermore, its return on assets (ROA) of 5.1% is below the NL Electronic industry of 6.0%, indicating Neways Electronics International's are utilized less efficiently. However, its return on capital (ROC), which also accounts for Neways Electronics International’s debt level, has increased over the past 3 years from 11% to 14%.
What does this mean?
Though Neways Electronics International's past data is helpful, it is only one aspect of my investment thesis. Companies that have performed well in the past, such as Neways Electronics International gives investors conviction. However, the next step would be to assess whether the future looks as optimistic. I recommend you continue to research Neways Electronics International to get a better picture of the stock by looking at:
Future Outlook: What are well-informed industry analysts predicting for NEWAY’s future growth? Take a look at our free research report of analyst consensus for NEWAY’s outlook.
Financial Health: Are NEWAY’s operations financially sustainable? Balance sheets can be hard to analyze, which is why we’ve done it for you. Check out our financial health checks here.
Other High-Performing Stocks: Are there other stocks that provide better prospects with proven track records? Explore our free list of these great stocks here.
NB: Figures in this article are calculated using data from the trailing twelve months from 30 June 2019. This may not be consistent with full year annual report figures.
If you spot an error that warrants correction, please contact the editor at editorial-team@simplywallst.com. This article by Simply Wall St is general in nature. It does not constitute a recommendation to buy or sell any stock, and does not take account of your objectives, or your financial situation. Simply Wall St has no position in the stocks mentioned.
We aim to bring you long-term focused research analysis driven by fundamental data. Note that our analysis may not factor in the latest price-sensitive company announcements or qualitative material. Thank you for reading.
