
 Yahoo Finance
 NFI Group (TSE:NFI) adds CA$88m to market cap in the past 7 days, though investors from five years ago are still down 56%
Generally speaking long term investing is the way to go. But that doesn't mean long term investors can avoid big losses. For example, after five long years the NFI Group Inc. (TSE:NFI) share price is a whole 61% lower. That's not a lot of fun for true believers.
While the last five years has been tough for NFI Group shareholders, this past week has shown signs of promise. So let's look at the longer term fundamentals and see if they've been the driver of the negative returns.
Check out our latest analysis for NFI Group
NFI Group isn't currently profitable, so most analysts would look to revenue growth to get an idea of how fast the underlying business is growing. Shareholders of unprofitable companies usually desire strong revenue growth. Some companies are willing to postpone profitability to grow revenue faster, but in that case one would hope for good top-line growth to make up for the lack of earnings.
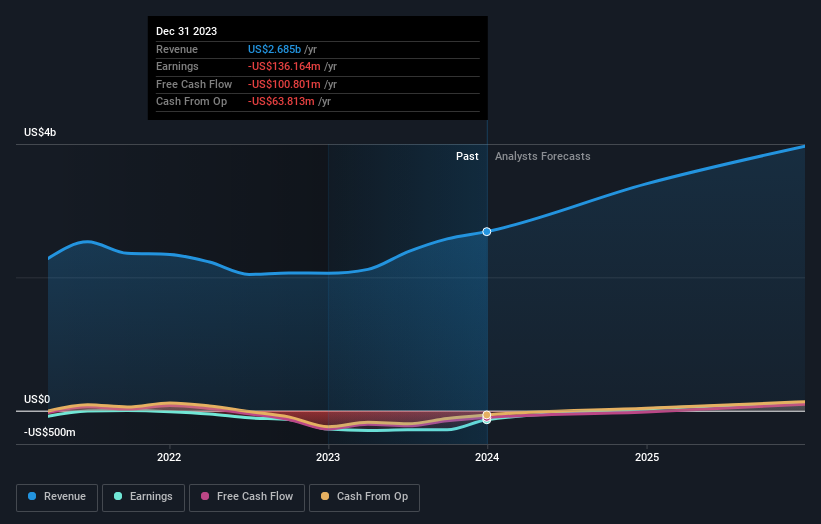
Over half a decade NFI Group reduced its trailing twelve month revenue by 3.4% for each year. That's not what investors generally want to see. The share price decline of 10% compound, over five years, is understandable given the company is losing money, and revenue is moving in the wrong direction. The chance of imminent investor enthusiasm for this stock seems slimmer than Louise Brooks. Ultimately, it may be worth watching - should revenue pick up, the share price might follow.
The company's revenue and earnings (over time) are depicted in the image below (click to see the exact numbers).
It's good to see that there was some significant insider buying in the last three months. That's a positive. That said, we think earnings and revenue growth trends are even more important factors to consider. So we recommend checking out this free report showing consensus forecasts
A Dividend Lost
The value of past dividends are accounted for in the total shareholder return (TSR), but not in the share price return mentioned above. In some ways, TSR is a better measure of how well an investment has performed. Over the last 5 years, NFI Group generated a TSR of -56%, which is, of course, better than the share price return. Even though the company isn't paying dividends at the moment, it has done in the past.
A Different Perspective
It's good to see that NFI Group has rewarded shareholders with a total shareholder return of 60% in the last twelve months. Notably the five-year annualised TSR loss of 9% per year compares very unfavourably with the recent share price performance. The long term loss makes us cautious, but the short term TSR gain certainly hints at a brighter future. It's always interesting to track share price performance over the longer term. But to understand NFI Group better, we need to consider many other factors. For example, we've discovered 2 warning signs for NFI Group that you should be aware of before investing here.
If you like to buy stocks alongside management, then you might just love this free list of companies. (Hint: insiders have been buying them).
Please note, the market returns quoted in this article reflect the market weighted average returns of stocks that currently trade on Canadian exchanges.
Have feedback on this article? Concerned about the content? Get in touch with us directly. Alternatively, email editorial-team (at) simplywallst.com.
This article by Simply Wall St is general in nature. We provide commentary based on historical data and analyst forecasts only using an unbiased methodology and our articles are not intended to be financial advice. It does not constitute a recommendation to buy or sell any stock, and does not take account of your objectives, or your financial situation. We aim to bring you long-term focused analysis driven by fundamental data. Note that our analysis may not factor in the latest price-sensitive company announcements or qualitative material. Simply Wall St has no position in any stocks mentioned.
