
 Yahoo Finance
 NIKE (NYSE:NKE) Will Want To Turn Around Its Return Trends
If you're not sure where to start when looking for the next multi-bagger, there are a few key trends you should keep an eye out for. Firstly, we'll want to see a proven return on capital employed (ROCE) that is increasing, and secondly, an expanding base of capital employed. Ultimately, this demonstrates that it's a business that is reinvesting profits at increasing rates of return. So when we looked at NIKE (NYSE:NKE), they do have a high ROCE, but we weren't exactly elated from how returns are trending.
Return On Capital Employed (ROCE): What Is It?
For those who don't know, ROCE is a measure of a company's yearly pre-tax profit (its return), relative to the capital employed in the business. Analysts use this formula to calculate it for NIKE:
Return on Capital Employed = Earnings Before Interest and Tax (EBIT) ÷ (Total Assets - Current Liabilities)
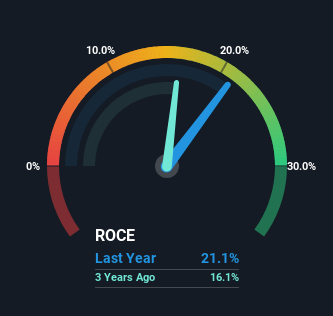
0.21 = US$6.0b ÷ (US$37b - US$9.0b) (Based on the trailing twelve months to February 2024).
Thus, NIKE has an ROCE of 21%. In absolute terms that's a great return and it's even better than the Luxury industry average of 12%.
Check out our latest analysis for NIKE
In the above chart we have measured NIKE's prior ROCE against its prior performance, but the future is arguably more important. If you're interested, you can view the analysts predictions in our free analyst report for NIKE .
The Trend Of ROCE
In terms of NIKE's historical ROCE movements, the trend isn't fantastic. To be more specific, while the ROCE is still high, it's fallen from 31% where it was five years ago. However it looks like NIKE might be reinvesting for long term growth because while capital employed has increased, the company's sales haven't changed much in the last 12 months. It's worth keeping an eye on the company's earnings from here on to see if these investments do end up contributing to the bottom line.
The Bottom Line On NIKE's ROCE
In summary, NIKE is reinvesting funds back into the business for growth but unfortunately it looks like sales haven't increased much just yet. Unsurprisingly, the stock has only gained 24% over the last five years, which potentially indicates that investors are accounting for this going forward. As a result, if you're hunting for a multi-bagger, we think you'd have more luck elsewhere.
NIKE could be trading at an attractive price in other respects, so you might find our free intrinsic value estimation for NKE on our platform quite valuable.
If you'd like to see other companies earning high returns, check out our free list of companies earning high returns with solid balance sheets here.
Have feedback on this article? Concerned about the content? Get in touch with us directly. Alternatively, email editorial-team (at) simplywallst.com.
This article by Simply Wall St is general in nature. We provide commentary based on historical data and analyst forecasts only using an unbiased methodology and our articles are not intended to be financial advice. It does not constitute a recommendation to buy or sell any stock, and does not take account of your objectives, or your financial situation. We aim to bring you long-term focused analysis driven by fundamental data. Note that our analysis may not factor in the latest price-sensitive company announcements or qualitative material. Simply Wall St has no position in any stocks mentioned.
