
 Yahoo Finance
 NL Industries (NYSE:NL) Is Experiencing Growth In Returns On Capital
If we want to find a potential multi-bagger, often there are underlying trends that can provide clues. Firstly, we'll want to see a proven return on capital employed (ROCE) that is increasing, and secondly, an expanding base of capital employed. If you see this, it typically means it's a company with a great business model and plenty of profitable reinvestment opportunities. So when we looked at NL Industries (NYSE:NL) and its trend of ROCE, we really liked what we saw.
Return On Capital Employed (ROCE): What Is It?
Just to clarify if you're unsure, ROCE is a metric for evaluating how much pre-tax income (in percentage terms) a company earns on the capital invested in its business. The formula for this calculation on NL Industries is:
Return on Capital Employed = Earnings Before Interest and Tax (EBIT) ÷ (Total Assets - Current Liabilities)
0.027 = US$15m ÷ (US$583m - US$32m) (Based on the trailing twelve months to September 2022).
Therefore, NL Industries has an ROCE of 2.7%. Ultimately, that's a low return and it under-performs the Commercial Services industry average of 9.3%.
View our latest analysis for NL Industries
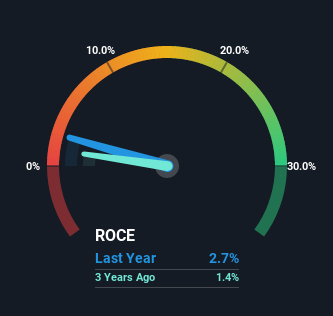
Historical performance is a great place to start when researching a stock so above you can see the gauge for NL Industries' ROCE against it's prior returns. If you'd like to look at how NL Industries has performed in the past in other metrics, you can view this free graph of past earnings, revenue and cash flow.
What The Trend Of ROCE Can Tell Us
While in absolute terms it isn't a high ROCE, it's promising to see that it has been moving in the right direction. The data shows that returns on capital have increased substantially over the last five years to 2.7%. The company is effectively making more money per dollar of capital used, and it's worth noting that the amount of capital has increased too, by 21%. So we're very much inspired by what we're seeing at NL Industries thanks to its ability to profitably reinvest capital.
Our Take On NL Industries' ROCE
To sum it up, NL Industries has proven it can reinvest in the business and generate higher returns on that capital employed, which is terrific. Astute investors may have an opportunity here because the stock has declined 43% in the last five years. With that in mind, we believe the promising trends warrant this stock for further investigation.
One more thing: We've identified 2 warning signs with NL Industries (at least 1 which doesn't sit too well with us) , and understanding these would certainly be useful.
While NL Industries isn't earning the highest return, check out this free list of companies that are earning high returns on equity with solid balance sheets.
Have feedback on this article? Concerned about the content? Get in touch with us directly. Alternatively, email editorial-team (at) simplywallst.com.
This article by Simply Wall St is general in nature. We provide commentary based on historical data and analyst forecasts only using an unbiased methodology and our articles are not intended to be financial advice. It does not constitute a recommendation to buy or sell any stock, and does not take account of your objectives, or your financial situation. We aim to bring you long-term focused analysis driven by fundamental data. Note that our analysis may not factor in the latest price-sensitive company announcements or qualitative material. Simply Wall St has no position in any stocks mentioned.
Join A Paid User Research Session
You’ll receive a US$30 Amazon Gift card for 1 hour of your time while helping us build better investing tools for the individual investors like yourself. Sign up here
