
 Yahoo Finance
 NVE (NASDAQ:NVEC) Is Investing Its Capital With Increasing Efficiency
There are a few key trends to look for if we want to identify the next multi-bagger. Ideally, a business will show two trends; firstly a growing return on capital employed (ROCE) and secondly, an increasing amount of capital employed. Ultimately, this demonstrates that it's a business that is reinvesting profits at increasing rates of return. With that in mind, the ROCE of NVE (NASDAQ:NVEC) looks great, so lets see what the trend can tell us.
Return On Capital Employed (ROCE): What Is It?
For those who don't know, ROCE is a measure of a company's yearly pre-tax profit (its return), relative to the capital employed in the business. To calculate this metric for NVE, this is the formula:
Return on Capital Employed = Earnings Before Interest and Tax (EBIT) ÷ (Total Assets - Current Liabilities)
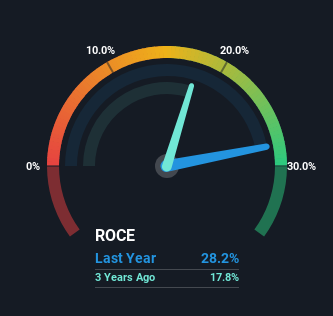
0.28 = US$19m ÷ (US$67m - US$1.0m) (Based on the trailing twelve months to March 2024).
So, NVE has an ROCE of 28%. In absolute terms that's a great return and it's even better than the Semiconductor industry average of 9.7%.
View our latest analysis for NVE
While the past is not representative of the future, it can be helpful to know how a company has performed historically, which is why we have this chart above. If you'd like to look at how NVE has performed in the past in other metrics, you can view this free graph of NVE's past earnings, revenue and cash flow.
How Are Returns Trending?
You'd find it hard not to be impressed with the ROCE trend at NVE. The figures show that over the last five years, returns on capital have grown by 46%. The company is now earning US$0.3 per dollar of capital employed. Speaking of capital employed, the company is actually utilizing 21% less than it was five years ago, which can be indicative of a business that's improving its efficiency. NVE may be selling some assets so it's worth investigating if the business has plans for future investments to increase returns further still.
Our Take On NVE's ROCE
From what we've seen above, NVE has managed to increase it's returns on capital all the while reducing it's capital base. And with a respectable 44% awarded to those who held the stock over the last five years, you could argue that these developments are starting to get the attention they deserve. Therefore, we think it would be worth your time to check if these trends are going to continue.
Like most companies, NVE does come with some risks, and we've found 1 warning sign that you should be aware of.
If you'd like to see other companies earning high returns, check out our free list of companies earning high returns with solid balance sheets here.
Have feedback on this article? Concerned about the content? Get in touch with us directly. Alternatively, email editorial-team (at) simplywallst.com.
This article by Simply Wall St is general in nature. We provide commentary based on historical data and analyst forecasts only using an unbiased methodology and our articles are not intended to be financial advice. It does not constitute a recommendation to buy or sell any stock, and does not take account of your objectives, or your financial situation. We aim to bring you long-term focused analysis driven by fundamental data. Note that our analysis may not factor in the latest price-sensitive company announcements or qualitative material. Simply Wall St has no position in any stocks mentioned.