
 Yahoo Finance
 What NXP Semiconductors N.V.'s (NASDAQ:NXPI) ROE Can Tell Us
While some investors are already well versed in financial metrics (hat tip), this article is for those who would like to learn about Return On Equity (ROE) and why it is important. To keep the lesson grounded in practicality, we'll use ROE to better understand NXP Semiconductors N.V. (NASDAQ:NXPI).
ROE or return on equity is a useful tool to assess how effectively a company can generate returns on the investment it received from its shareholders. In other words, it is a profitability ratio which measures the rate of return on the capital provided by the company's shareholders.
View our latest analysis for NXP Semiconductors
How To Calculate Return On Equity?
The formula for return on equity is:
Return on Equity = Net Profit (from continuing operations) ÷ Shareholders' Equity
So, based on the above formula, the ROE for NXP Semiconductors is:
14% = US$1.1b ÷ US$7.7b (Based on the trailing twelve months to July 2021).
The 'return' refers to a company's earnings over the last year. So, this means that for every $1 of its shareholder's investments, the company generates a profit of $0.14.
Does NXP Semiconductors Have A Good ROE?
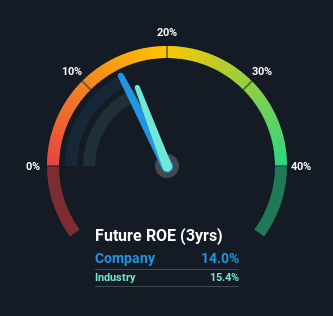
Arguably the easiest way to assess company's ROE is to compare it with the average in its industry. The limitation of this approach is that some companies are quite different from others, even within the same industry classification. The image below shows that NXP Semiconductors has an ROE that is roughly in line with the Semiconductor industry average (15%).
That's neither particularly good, nor bad. Although the ROE is similar to the industry, we should still perform further checks to see if the company's ROE is being boosted by high debt levels. If true, then it is more an indication of risk than the potential. To know the 2 risks we have identified for NXP Semiconductors visit our risks dashboard for free.
How Does Debt Impact ROE?
Most companies need money -- from somewhere -- to grow their profits. That cash can come from issuing shares, retained earnings, or debt. In the first and second cases, the ROE will reflect this use of cash for investment in the business. In the latter case, the use of debt will improve the returns, but will not change the equity. Thus the use of debt can improve ROE, albeit along with extra risk in the case of stormy weather, metaphorically speaking.
NXP Semiconductors' Debt And Its 14% ROE
NXP Semiconductors does use a high amount of debt to increase returns. It has a debt to equity ratio of 1.25. There's no doubt its ROE is decent, but the very high debt the company carries is not too exciting to see. Debt does bring extra risk, so it's only really worthwhile when a company generates some decent returns from it.
Summary
Return on equity is one way we can compare its business quality of different companies. A company that can achieve a high return on equity without debt could be considered a high quality business. All else being equal, a higher ROE is better.
But ROE is just one piece of a bigger puzzle, since high quality businesses often trade on high multiples of earnings. It is important to consider other factors, such as future profit growth -- and how much investment is required going forward. So I think it may be worth checking this free report on analyst forecasts for the company.
If you would prefer check out another company -- one with potentially superior financials -- then do not miss this free list of interesting companies, that have HIGH return on equity and low debt.
This article by Simply Wall St is general in nature. We provide commentary based on historical data and analyst forecasts only using an unbiased methodology and our articles are not intended to be financial advice. It does not constitute a recommendation to buy or sell any stock, and does not take account of your objectives, or your financial situation. We aim to bring you long-term focused analysis driven by fundamental data. Note that our analysis may not factor in the latest price-sensitive company announcements or qualitative material. Simply Wall St has no position in any stocks mentioned.
Have feedback on this article? Concerned about the content? Get in touch with us directly. Alternatively, email editorial-team (at) simplywallst.com.
