
 Yahoo Finance
 Was Ocean Wilsons Holdings Limited’s (LON:OCN) Earnings Growth Better Than The Industry’s?

Measuring Ocean Wilsons Holdings Limited’s (LON:OCN) track record of past performance is an insightful exercise for investors. It enables us to reflect on whether the company has met or exceed expectations, which is a powerful signal for future performance. Below, I will assess OCN’s recent performance announced on 31 December 2017 and compare these figures to its historical trend and industry movements. See our latest analysis for Ocean Wilsons Holdings
Were OCN’s earnings stronger than its past performances and the industry?
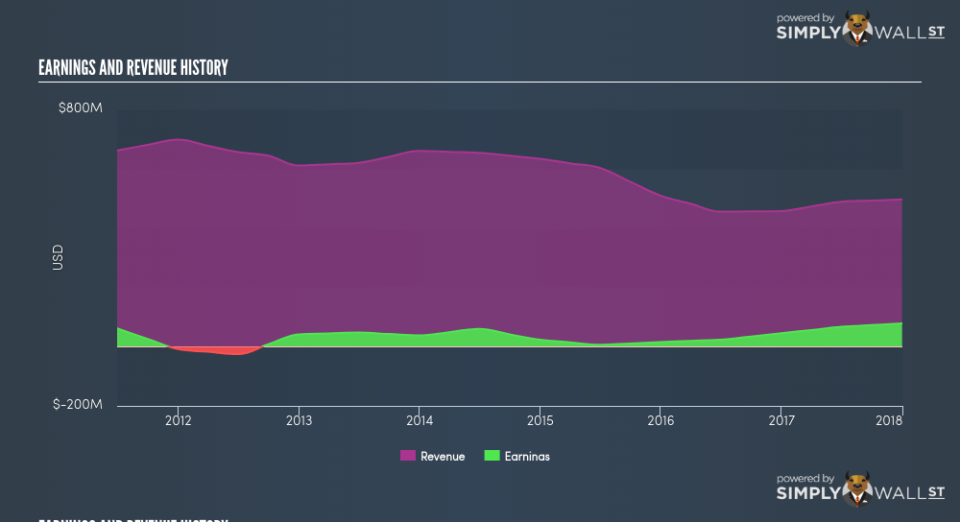
OCN’s trailing twelve-month earnings (from 31 December 2017) of UK£78.32m has jumped 73.80% compared to the previous year. Furthermore, this one-year growth rate has exceeded its 5-year annual growth average of 16.35%, indicating the rate at which OCN is growing has accelerated. What’s the driver of this growth? Let’s see whether it is solely attributable to an industry uplift, or if Ocean Wilsons Holdings has seen some company-specific growth.
In the past few years, Ocean Wilsons Holdings increased bottom-line, while its top-line declined, by effectively controlling its costs. This has caused to a margin expansion and profitability over time. Viewing growth from a sector-level, the UK infrastructure industry has been growing, albeit, at a unexciting single-digit rate of 9.43% in the previous twelve months, and 8.26% over the last five years. This means that whatever uplift the industry is gaining from, Ocean Wilsons Holdings is able to leverage this to its advantage.
In terms of returns from investment, Ocean Wilsons Holdings has not invested its equity funds well, leading to a 13.28% return on equity (ROE), below the sensible minimum of 20%. However, its return on assets (ROA) of 6.10% exceeds the GB Infrastructure industry of 5.70%, indicating Ocean Wilsons Holdings has used its assets more efficiently. And finally, its return on capital (ROC), which also accounts for Ocean Wilsons Holdings’s debt level, has increased over the past 3 years from 6.10% to 9.34%. This correlates with a decrease in debt holding, with debt-to-equity ratio declining from 48.92% to 43.37% over the past 5 years.
What does this mean?
Ocean Wilsons Holdings’s track record can be a valuable insight into its earnings performance, but it certainly doesn’t tell the whole story. Companies that have performed well in the past, such as Ocean Wilsons Holdings gives investors conviction. However, the next step would be to assess whether the future looks as optimistic. I suggest you continue to research Ocean Wilsons Holdings to get a better picture of the stock by looking at:
Future Outlook: What are well-informed industry analysts predicting for OCN’s future growth? Take a look at our free research report of analyst consensus for OCN’s outlook.
Financial Health: Is OCN’s operations financially sustainable? Balance sheets can be hard to analyze, which is why we’ve done it for you. Check out our financial health checks here.
Other High-Performing Stocks: Are there other stocks that provide better prospects with proven track records? Explore our free list of these great stocks here.
NB: Figures in this article are calculated using data from the trailing twelve months from 31 December 2017. This may not be consistent with full year annual report figures.
To help readers see pass the short term volatility of the financial market, we aim to bring you a long-term focused research analysis purely driven by fundamental data. Note that our analysis does not factor in the latest price sensitive company announcements.
The author is an independent contributor and at the time of publication had no position in the stocks mentioned.
