
 Yahoo Finance
 The one-year earnings decline is not helping Imperial Petroleum's (NASDAQ:IMPP share price, as stock falls another 12% in past week
Imperial Petroleum Inc. (NASDAQ:IMPP) shareholders should be happy to see the share price up 16% in the last quarter. But that doesn't change the fact that the returns over the last year have been less than pleasing. In fact, the price has declined 14% in a year, falling short of the returns you could get by investing in an index fund.
Since Imperial Petroleum has shed US$15m from its value in the past 7 days, let's see if the longer term decline has been driven by the business' economics.
See our latest analysis for Imperial Petroleum
In his essay The Superinvestors of Graham-and-Doddsville Warren Buffett described how share prices do not always rationally reflect the value of a business. One way to examine how market sentiment has changed over time is to look at the interaction between a company's share price and its earnings per share (EPS).
Unfortunately Imperial Petroleum reported an EPS drop of 63% for the last year. The share price fall of 14% isn't as bad as the reduction in earnings per share. So the market may not be too worried about the EPS figure, at the moment -- or it may have expected earnings to drop faster.
You can see below how EPS has changed over time (discover the exact values by clicking on the image).
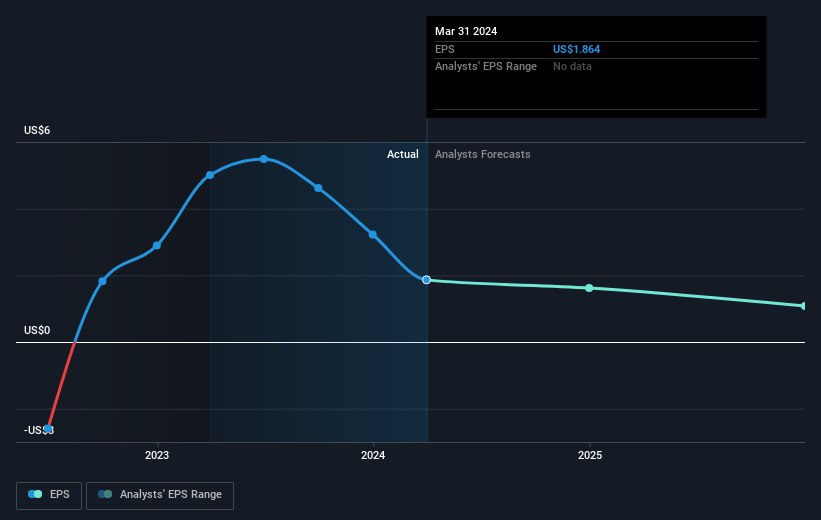
It is of course excellent to see how Imperial Petroleum has grown profits over the years, but the future is more important for shareholders. It might be well worthwhile taking a look at our free report on how its financial position has changed over time.
What About The Total Shareholder Return (TSR)?
We've already covered Imperial Petroleum's share price action, but we should also mention its total shareholder return (TSR). The TSR attempts to capture the value of dividends (as if they were reinvested) as well as any spin-offs or discounted capital raisings offered to shareholders. Imperial Petroleum hasn't been paying dividends, but its TSR of -0.09% exceeds its share price return of -14%, implying it has either spun-off a business, or raised capital at a discount; thereby providing additional value to shareholders.
A Different Perspective
While Imperial Petroleum shareholders are down 0.09% for the year, the market itself is up 25%. While the aim is to do better than that, it's worth recalling that even great long-term investments sometimes underperform for a year or more. It's great to see a nice little 16% rebound in the last three months. This could just be a bounce because the selling was too aggressive, but fingers crossed it's the start of a new trend. I find it very interesting to look at share price over the long term as a proxy for business performance. But to truly gain insight, we need to consider other information, too. Even so, be aware that Imperial Petroleum is showing 3 warning signs in our investment analysis , and 2 of those don't sit too well with us...
We will like Imperial Petroleum better if we see some big insider buys. While we wait, check out this free list of undervalued stocks (mostly small caps) with considerable, recent, insider buying.
Please note, the market returns quoted in this article reflect the market weighted average returns of stocks that currently trade on American exchanges.
Have feedback on this article? Concerned about the content? Get in touch with us directly. Alternatively, email editorial-team (at) simplywallst.com.
This article by Simply Wall St is general in nature. We provide commentary based on historical data and analyst forecasts only using an unbiased methodology and our articles are not intended to be financial advice. It does not constitute a recommendation to buy or sell any stock, and does not take account of your objectives, or your financial situation. We aim to bring you long-term focused analysis driven by fundamental data. Note that our analysis may not factor in the latest price-sensitive company announcements or qualitative material. Simply Wall St has no position in any stocks mentioned.
