
 Yahoo Finance
 One Thing To Remember About The Kimco Realty Corporation (NYSE:KIM) Share Price

Anyone researching Kimco Realty Corporation (NYSE:KIM) might want to consider the historical volatility of the share price. Volatility is considered to be a measure of risk in modern finance theory. Investors may think of volatility as falling into two main categories. The first type is company specific volatility. Investors use diversification across uncorrelated stocks to reduce this kind of price volatility across the portfolio. The other type, which cannot be diversified away, is the volatility of the entire market. Every stock in the market is exposed to this volatility, which is linked to the fact that stocks prices are correlated in an efficient market.
Some stocks mimic the volatility of the market quite closely, while others demonstrate muted, exagerrated or uncorrelated price movements. Some investors use beta as a measure of how much a certain stock is impacted by market risk (volatility). While we should keep in mind that Warren Buffett has cautioned that 'Volatility is far from synonymous with risk', beta is still a useful factor to consider. To make good use of it you must first know that the beta of the overall market is one. A stock with a beta greater than one is more sensitive to broader market movements than a stock with a beta of less than one.
View our latest analysis for Kimco Realty
What KIM's beta value tells investors
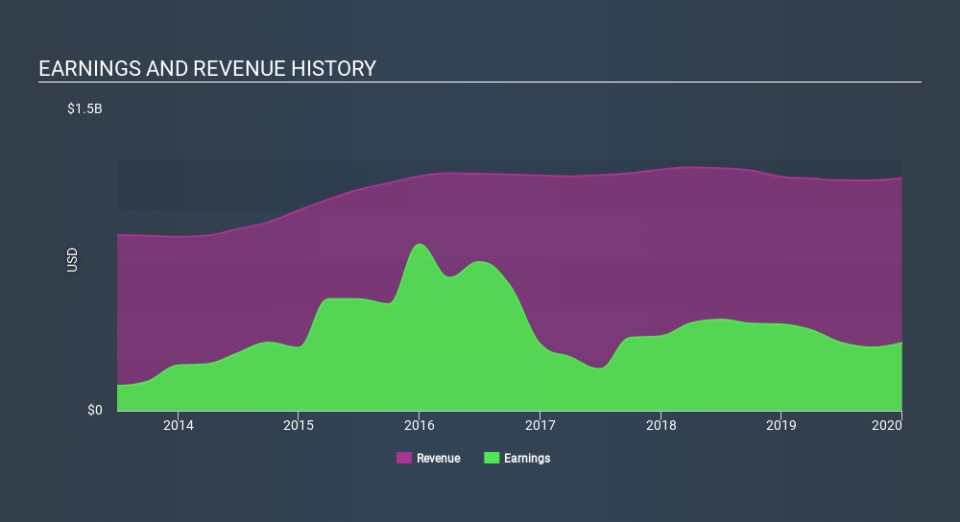
Looking at the last five years, Kimco Realty has a beta of 1.22. The fact that this is well above 1 indicates that its share price movements have shown sensitivity to overall market volatility. If this beta value holds true in the future, Kimco Realty shares are likely to rise more than the market when the market is going up, but fall faster when the market is going down. Share price volatility is well worth considering, but most long term investors consider the history of revenue and earnings growth to be more important. Take a look at how Kimco Realty fares in that regard, below.
How does KIM's size impact its beta?
Kimco Realty is a reasonably big company, with a market capitalisation of US$4.0b. Most companies this size are actively traded with decent volumes of shares changing hands each day. It takes deep pocketed investors to influence the share price of a large company, so it's a little unusual to see companies this size with high beta values. It may be that that this company is more heavily impacted by broader economic factors than most.
What this means for you:
Since Kimco Realty tends to move up when the market is going up, and down when it's going down, potential investors may wish to reflect on the overall market, when considering the stock. In order to fully understand whether KIM is a good investment for you, we also need to consider important company-specific fundamentals such as Kimco Realty’s financial health and performance track record. I highly recommend you dive deeper by considering the following:
Future Outlook: What are well-informed industry analysts predicting for KIM’s future growth? Take a look at our free research report of analyst consensus for KIM’s outlook.
Past Track Record: Has KIM been consistently performing well irrespective of the ups and downs in the market? Go into more detail in the past performance analysis and take a look at the free visual representations of KIM's historicals for more clarity.
Other Interesting Stocks: It's worth checking to see how KIM measures up against other companies on valuation. You could start with this free list of prospective options.
If you spot an error that warrants correction, please contact the editor at editorial-team@simplywallst.com. This article by Simply Wall St is general in nature. It does not constitute a recommendation to buy or sell any stock, and does not take account of your objectives, or your financial situation. Simply Wall St has no position in the stocks mentioned.
We aim to bring you long-term focused research analysis driven by fundamental data. Note that our analysis may not factor in the latest price-sensitive company announcements or qualitative material. Thank you for reading.
