
 Yahoo Finance
 O'Reilly Automotive's (NASDAQ:ORLY) five-year earnings growth trails the impressive shareholder returns
When you buy shares in a company, it's worth keeping in mind the possibility that it could fail, and you could lose your money. But when you pick a company that is really flourishing, you can make more than 100%. For instance, the price of O'Reilly Automotive, Inc. (NASDAQ:ORLY) stock is up an impressive 189% over the last five years. In more good news, the share price has risen 9.8% in thirty days.
The past week has proven to be lucrative for O'Reilly Automotive investors, so let's see if fundamentals drove the company's five-year performance.
View our latest analysis for O'Reilly Automotive
In his essay The Superinvestors of Graham-and-Doddsville Warren Buffett described how share prices do not always rationally reflect the value of a business. One flawed but reasonable way to assess how sentiment around a company has changed is to compare the earnings per share (EPS) with the share price.
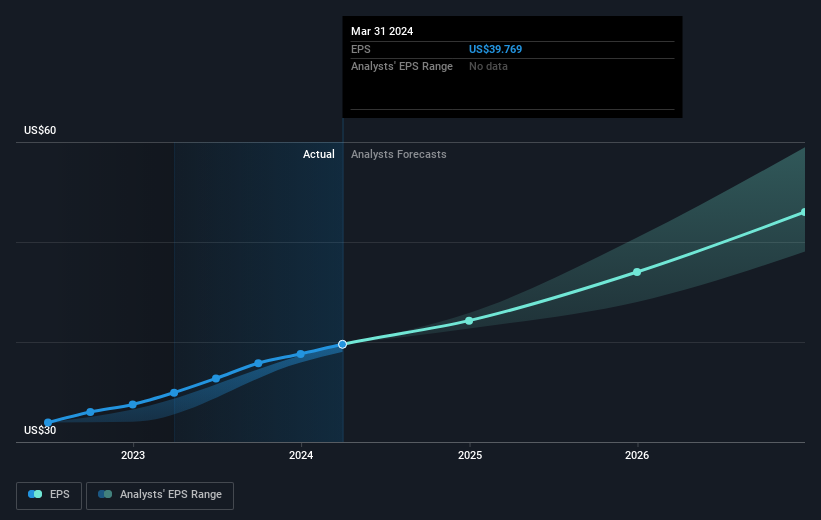
During five years of share price growth, O'Reilly Automotive achieved compound earnings per share (EPS) growth of 19% per year. This EPS growth is reasonably close to the 24% average annual increase in the share price. That suggests that the market sentiment around the company hasn't changed much over that time. Rather, the share price has approximately tracked EPS growth.
The graphic below depicts how EPS has changed over time (unveil the exact values by clicking on the image).
It's probably worth noting that the CEO is paid less than the median at similar sized companies. But while CEO remuneration is always worth checking, the really important question is whether the company can grow earnings going forward. This free interactive report on O'Reilly Automotive's earnings, revenue and cash flow is a great place to start, if you want to investigate the stock further.
A Different Perspective
O'Reilly Automotive shareholders are up 16% for the year. But that was short of the market average. On the bright side, the longer term returns (running at about 24% a year, over half a decade) look better. It's quite possible the business continues to execute with prowess, even as the share price gains are slowing. It's always interesting to track share price performance over the longer term. But to understand O'Reilly Automotive better, we need to consider many other factors. Even so, be aware that O'Reilly Automotive is showing 3 warning signs in our investment analysis , and 1 of those makes us a bit uncomfortable...
If you would prefer to check out another company -- one with potentially superior financials -- then do not miss this free list of companies that have proven they can grow earnings.
Please note, the market returns quoted in this article reflect the market weighted average returns of stocks that currently trade on American exchanges.
Have feedback on this article? Concerned about the content? Get in touch with us directly. Alternatively, email editorial-team (at) simplywallst.com.
This article by Simply Wall St is general in nature. We provide commentary based on historical data and analyst forecasts only using an unbiased methodology and our articles are not intended to be financial advice. It does not constitute a recommendation to buy or sell any stock, and does not take account of your objectives, or your financial situation. We aim to bring you long-term focused analysis driven by fundamental data. Note that our analysis may not factor in the latest price-sensitive company announcements or qualitative material. Simply Wall St has no position in any stocks mentioned.
Have feedback on this article? Concerned about the content? Get in touch with us directly. Alternatively, email editorial-team@simplywallst.com
