
 Yahoo Finance
 Overseas Shipholding Group (NYSE:OSG) Is Doing The Right Things To Multiply Its Share Price
If you're looking for a multi-bagger, there's a few things to keep an eye out for. Ideally, a business will show two trends; firstly a growing return on capital employed (ROCE) and secondly, an increasing amount of capital employed. Basically this means that a company has profitable initiatives that it can continue to reinvest in, which is a trait of a compounding machine. So on that note, Overseas Shipholding Group (NYSE:OSG) looks quite promising in regards to its trends of return on capital.
Understanding Return On Capital Employed (ROCE)
If you haven't worked with ROCE before, it measures the 'return' (pre-tax profit) a company generates from capital employed in its business. Analysts use this formula to calculate it for Overseas Shipholding Group:
Return on Capital Employed = Earnings Before Interest and Tax (EBIT) ÷ (Total Assets - Current Liabilities)
0.11 = US$99m ÷ (US$1.1b - US$174m) (Based on the trailing twelve months to March 2024).
Thus, Overseas Shipholding Group has an ROCE of 11%. In absolute terms, that's a pretty normal return, and it's somewhat close to the Oil and Gas industry average of 13%.
Check out our latest analysis for Overseas Shipholding Group
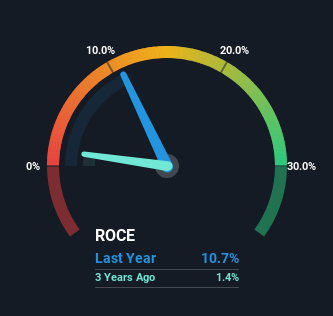
Historical performance is a great place to start when researching a stock so above you can see the gauge for Overseas Shipholding Group's ROCE against it's prior returns. If you'd like to look at how Overseas Shipholding Group has performed in the past in other metrics, you can view this free graph of Overseas Shipholding Group's past earnings, revenue and cash flow.
What Does the ROCE Trend For Overseas Shipholding Group Tell Us?
Overseas Shipholding Group is showing promise given that its ROCE is trending up and to the right. More specifically, while the company has kept capital employed relatively flat over the last five years, the ROCE has climbed 402% in that same time. So our take on this is that the business has increased efficiencies to generate these higher returns, all the while not needing to make any additional investments. The company is doing well in that sense, and it's worth investigating what the management team has planned for long term growth prospects.
Our Take On Overseas Shipholding Group's ROCE
As discussed above, Overseas Shipholding Group appears to be getting more proficient at generating returns since capital employed has remained flat but earnings (before interest and tax) are up. Since the stock has returned a staggering 358% to shareholders over the last five years, it looks like investors are recognizing these changes. Therefore, we think it would be worth your time to check if these trends are going to continue.
One more thing to note, we've identified 2 warning signs with Overseas Shipholding Group and understanding these should be part of your investment process.
While Overseas Shipholding Group isn't earning the highest return, check out this free list of companies that are earning high returns on equity with solid balance sheets.
Have feedback on this article? Concerned about the content? Get in touch with us directly. Alternatively, email editorial-team (at) simplywallst.com.
This article by Simply Wall St is general in nature. We provide commentary based on historical data and analyst forecasts only using an unbiased methodology and our articles are not intended to be financial advice. It does not constitute a recommendation to buy or sell any stock, and does not take account of your objectives, or your financial situation. We aim to bring you long-term focused analysis driven by fundamental data. Note that our analysis may not factor in the latest price-sensitive company announcements or qualitative material. Simply Wall St has no position in any stocks mentioned.
Have feedback on this article? Concerned about the content? Get in touch with us directly. Alternatively, email editorial-team@simplywallst.com
