
 Yahoo Finance
 Overstock.com (NASDAQ:OSTK) Might Have The Makings Of A Multi-Bagger
If we want to find a stock that could multiply over the long term, what are the underlying trends we should look for? Firstly, we'd want to identify a growing return on capital employed (ROCE) and then alongside that, an ever-increasing base of capital employed. If you see this, it typically means it's a company with a great business model and plenty of profitable reinvestment opportunities. So on that note, Overstock.com (NASDAQ:OSTK) looks quite promising in regards to its trends of return on capital.
Return On Capital Employed (ROCE): What is it?
For those who don't know, ROCE is a measure of a company's yearly pre-tax profit (its return), relative to the capital employed in the business. To calculate this metric for Overstock.com, this is the formula:
Return on Capital Employed = Earnings Before Interest and Tax (EBIT) ÷ (Total Assets - Current Liabilities)
0.11 = US$82m ÷ (US$1.1b - US$372m) (Based on the trailing twelve months to June 2021).
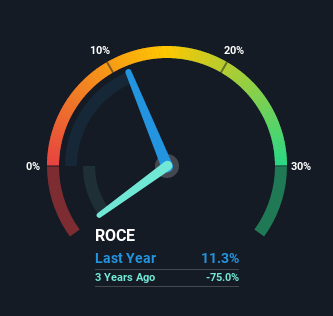
Thus, Overstock.com has an ROCE of 11%. That's a relatively normal return on capital, and it's around the 12% generated by the Online Retail industry.
Check out our latest analysis for Overstock.com
In the above chart we have measured Overstock.com's prior ROCE against its prior performance, but the future is arguably more important. If you'd like, you can check out the forecasts from the analysts covering Overstock.com here for free.
How Are Returns Trending?
Overstock.com has recently broken into profitability so their prior investments seem to be paying off. The company was generating losses five years ago, but now it's earning 11% which is a sight for sore eyes. And unsurprisingly, like most companies trying to break into the black, Overstock.com is utilizing 244% more capital than it was five years ago. This can tell us that the company has plenty of reinvestment opportunities that are able to generate higher returns.
In another part of our analysis, we noticed that the company's ratio of current liabilities to total assets decreased to 34%, which broadly means the business is relying less on its suppliers or short-term creditors to fund its operations. Therefore we can rest assured that the growth in ROCE is a result of the business' fundamental improvements, rather than a cooking class featuring this company's books.
The Key Takeaway
To the delight of most shareholders, Overstock.com has now broken into profitability. And a remarkable 438% total return over the last five years tells us that investors are expecting more good things to come in the future. In light of that, we think it's worth looking further into this stock because if Overstock.com can keep these trends up, it could have a bright future ahead.
Overstock.com does have some risks though, and we've spotted 1 warning sign for Overstock.com that you might be interested in.
While Overstock.com may not currently earn the highest returns, we've compiled a list of companies that currently earn more than 25% return on equity. Check out this free list here.
This article by Simply Wall St is general in nature. We provide commentary based on historical data and analyst forecasts only using an unbiased methodology and our articles are not intended to be financial advice. It does not constitute a recommendation to buy or sell any stock, and does not take account of your objectives, or your financial situation. We aim to bring you long-term focused analysis driven by fundamental data. Note that our analysis may not factor in the latest price-sensitive company announcements or qualitative material. Simply Wall St has no position in any stocks mentioned.
Have feedback on this article? Concerned about the content? Get in touch with us directly. Alternatively, email editorial-team (at) simplywallst.com.
