
 Yahoo Finance
 Oxford Industries (NYSE:OXM) Misses Q1 Sales Targets, Stock Drops

Fashion conglomerate Oxford Industries (NYSE:OXM) missed analysts' expectations in Q1 CY2024, with revenue down 5.2% year on year to $398.2 million. Next quarter's revenue guidance of $440 million also underwhelmed, coming in 2.7% below analysts' estimates. It made a non-GAAP profit of $2.66 per share, down from its profit of $3.78 per share in the same quarter last year.
Is now the time to buy Oxford Industries? Find out in our full research report.
Oxford Industries (OXM) Q1 CY2024 Highlights:
Revenue: $398.2 million vs analyst estimates of $404.8 million (1.6% miss)
EPS (non-GAAP): $2.66 vs analyst expectations of $2.68 (in line)
Revenue Guidance for Q2 CY2024 is $440 million at the midpoint, below analyst estimates of $452 million
The company dropped its revenue guidance for the full year from $1.65 billion to $1.61 billion at the midpoint, a 2.4% decrease
EPS (non-GAAP) Guidance for Q2 CY2024 is $3.05 at the midpoint, below analyst estimates of $3.58
Gross Margin (GAAP): 64.9%, in line with the same quarter last year
Free Cash Flow of $21.03 million, down 62% from the previous quarter
Market Capitalization: $1.60 billion
Tom Chubb, Chairman and CEO, commented, “Our strong brands and excellent team focused on executing our strategy allowed us to deliver sales and adjusted EPS within our guidance ranges for the first quarter despite continued macroeconomic headwinds and lower levels of consumer sentiment. While most economic indicators remain fairly positive, consumer sentiment has dropped meaningfully from levels at the start of this year and has driven the consumer to become more cautious than originally anticipated in her discretionary spending across our channels of distribution. Encouragingly, our comparable sales trend has improved sequentially and is positive in the second quarter to-date. However, given the continued choppiness in the market and lack of sustained positive momentum, coupled with the drop in consumer sentiment, we believe it is prudent to adopt a more conservative outlook for the balance of the year and therefore are lowering our fiscal 2024 sales and EPS guidance."
The parent company of Tommy Bahama, Oxford Industries (NYSE:OXM) is a lifestyle fashion conglomerate with brands that embody outdoor happiness.
Apparel, Accessories and Luxury Goods
Within apparel and accessories, not only do styles change more frequently today than decades past as fads travel through social media and the internet but consumers are also shifting the way they buy their goods, favoring omnichannel and e-commerce experiences. Some apparel, accessories, and luxury goods companies have made concerted efforts to adapt while those who are slower to move may fall behind.
Sales Growth
A company's long-term performance is an indicator of its overall business quality. While any business can experience short-term success, top-performing ones demonstrate sustained growth over multiple years. Over the last five years, Oxford Industries grew its sales at a weak 6.8% compounded annual growth rate. This shows it failed to expand its business in any major way.
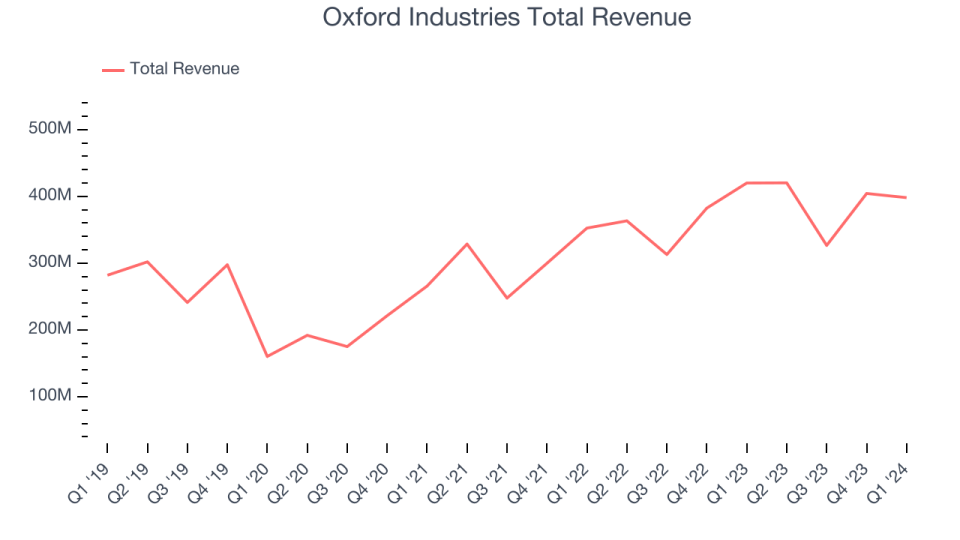
Long-term growth is the most important, but within consumer discretionary, product cycles are short and revenue can be hit-driven due to rapidly changing trends and consumer preferences. Oxford Industries's annualized revenue growth of 12.3% over the last two years is above its five-year trend, but we were still disappointed by the results.
This quarter, Oxford Industries missed Wall Street's estimates and reported a rather uninspiring 5.2% year-on-year revenue decline, generating $398.2 million of revenue. The company is guiding for revenue to rise 4.7% year on year to $440 million next quarter, slowing from the 15.7% year-on-year increase it recorded in the same quarter last year. Looking ahead, Wall Street expects sales to grow 6.8% over the next 12 months, an acceleration from this quarter.
Unless you’ve been living under a rock, it should be obvious by now that generative AI is going to have a huge impact on how large corporations do business. While Nvidia and AMD are trading close to all-time highs, we prefer a lesser-known (but still profitable) semiconductor stock benefitting from the rise of AI. Click here to access our free report on our favorite semiconductor growth story.
Cash Is King
Although earnings are undoubtedly valuable for assessing company performance, we believe cash is king because you can't use accounting profits to pay the bills.
Oxford Industries has shown mediocre cash profitability over the last two years, putting it in a pinch as it gives the company limited opportunities to reinvest, pay down debt, or return capital to shareholders. Its free cash flow margin averaged 8.5%, subpar for a consumer discretionary business.
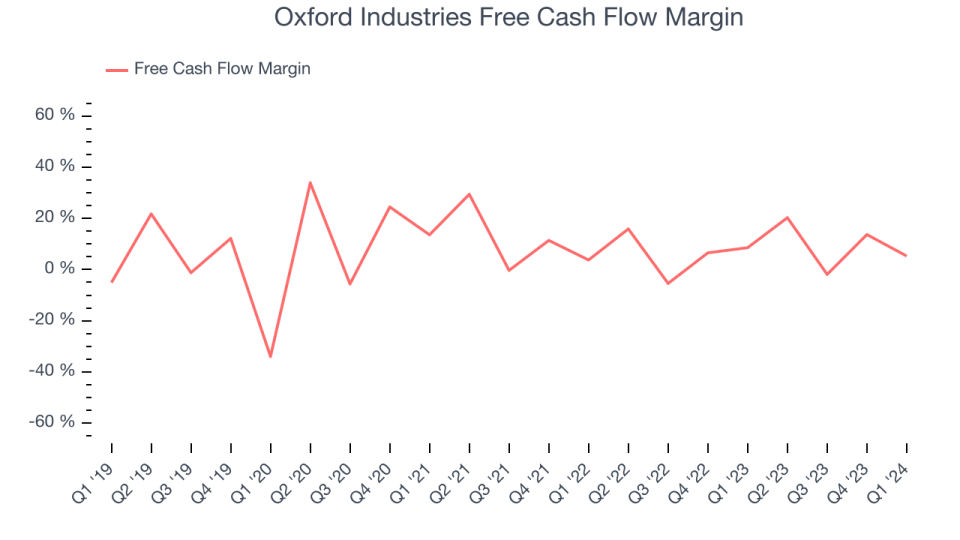
Oxford Industries's free cash flow clocked in at $21.03 million in Q1, equivalent to a 5.3% margin. The company's margin regressed as it was 3.3 percentage points lower than in the same quarter last year, but we wouldn't read too much into it because working capital needs can be seasonal and cause quarter-to-quarter swings in the short term.
Key Takeaways from Oxford Industries's Q1 Results
We struggled to find many strong positives in these results. Not only did this quarter's revenue miss analysts' estimates but also its revenue and earnings forecasts (both for next quarter and the full year) fell short. Overall, this was a bad quarter for Oxford Industries. The company is down 8.5% on the results and currently trades at $92.41 per share.
Oxford Industries may have had a tough quarter, but does that actually create an opportunity to invest right now? When making that decision, it's important to consider its valuation, business qualities, as well as what has happened in the latest quarter. We cover that in our actionable full research report which you can read here, it's free.
