
 Yahoo Finance
 Par Pacific Holdings (NYSE:PARR) shareholders have earned a 13% CAGR over the last three years
Par Pacific Holdings, Inc. (NYSE:PARR) shareholders might understandably be very concerned that the share price has dropped 38% in the last quarter. But that shouldn't obscure the pleasing returns achieved by shareholders over the last three years. In fact, the company's share price bested the return of its market index in that time, posting a gain of 46%.
So let's assess the underlying fundamentals over the last 3 years and see if they've moved in lock-step with shareholder returns.
Check out our latest analysis for Par Pacific Holdings
There is no denying that markets are sometimes efficient, but prices do not always reflect underlying business performance. One imperfect but simple way to consider how the market perception of a company has shifted is to compare the change in the earnings per share (EPS) with the share price movement.
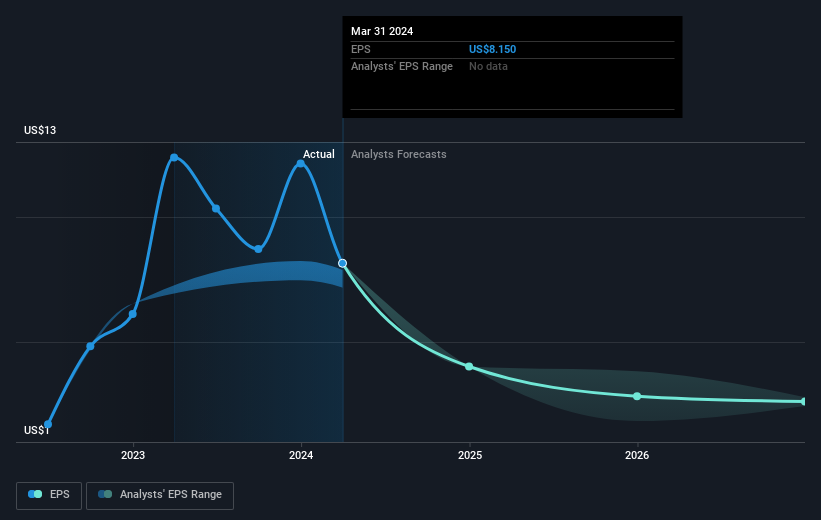
During three years of share price growth, Par Pacific Holdings moved from a loss to profitability. So we would expect a higher share price over the period.
The company's earnings per share (over time) is depicted in the image below (click to see the exact numbers).
It's probably worth noting that the CEO is paid less than the median at similar sized companies. But while CEO remuneration is always worth checking, the really important question is whether the company can grow earnings going forward. Dive deeper into the earnings by checking this interactive graph of Par Pacific Holdings' earnings, revenue and cash flow.
A Different Perspective
Investors in Par Pacific Holdings had a tough year, with a total loss of 1.2%, against a market gain of about 25%. Even the share prices of good stocks drop sometimes, but we want to see improvements in the fundamental metrics of a business, before getting too interested. On the bright side, long term shareholders have made money, with a gain of 4% per year over half a decade. If the fundamental data continues to indicate long term sustainable growth, the current sell-off could be an opportunity worth considering. While it is well worth considering the different impacts that market conditions can have on the share price, there are other factors that are even more important. Consider for instance, the ever-present spectre of investment risk. We've identified 2 warning signs with Par Pacific Holdings (at least 1 which can't be ignored) , and understanding them should be part of your investment process.
If you would prefer to check out another company -- one with potentially superior financials -- then do not miss this free list of companies that have proven they can grow earnings.
Please note, the market returns quoted in this article reflect the market weighted average returns of stocks that currently trade on American exchanges.
Have feedback on this article? Concerned about the content? Get in touch with us directly. Alternatively, email editorial-team (at) simplywallst.com.
This article by Simply Wall St is general in nature. We provide commentary based on historical data and analyst forecasts only using an unbiased methodology and our articles are not intended to be financial advice. It does not constitute a recommendation to buy or sell any stock, and does not take account of your objectives, or your financial situation. We aim to bring you long-term focused analysis driven by fundamental data. Note that our analysis may not factor in the latest price-sensitive company announcements or qualitative material. Simply Wall St has no position in any stocks mentioned.
Have feedback on this article? Concerned about the content? Get in touch with us directly. Alternatively, email editorial-team@simplywallst.com
