
 Yahoo Finance
 Paramount Global's Dividend Analysis
Exploring the Sustainability and Growth of Paramount Global's Dividends
Paramount Global (NASDAQ:PARA) recently announced a dividend of $0.05 per share, payable on 2024-07-01, with the ex-dividend date set for 2024-06-17. As investors look forward to this upcoming payment, the spotlight also shines on the company's dividend history, yield, and growth rates. Using the data from GuruFocus, let's look into Paramount Global's dividend performance and assess its sustainability.
What Does Paramount Global Do?
This Powerful Chart Made Peter Lynch 29% A Year For 13 Years
How to calculate the intrinsic value of a stock?
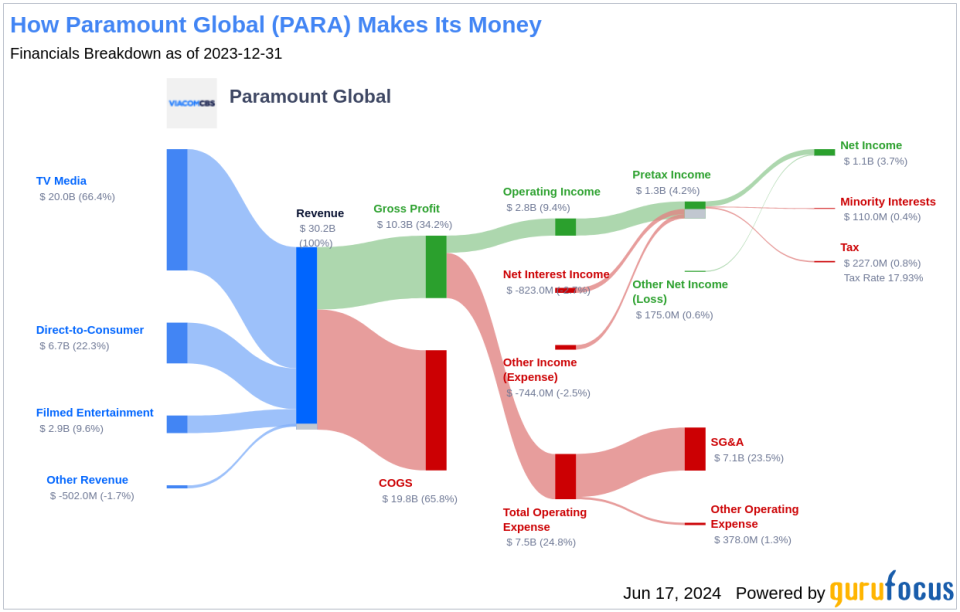
Paramount Global operates in three global business segments: TV media, filmed entertainment, and direct to consumer. The TV media business includes television production studios and various broadcast and cable networks, including CBS, 15 owned CBS affiliates, Paramount, Nickelodeon, MTV, BET, and VH1. Filmed entertainment consists multiple film studios, most importantly Paramount Pictures. The film studios produce and distribute movies that they license to movie theaters and other media outlets. Direct to consumer includes multiple streaming platforms, including Paramount+, which now includes Showtime, Pluto TV, and BET+. Much of the content on Paramount's streaming platforms is created by the production studios housed within the firm's other two business segments.
A Glimpse at Paramount Global's Dividend History
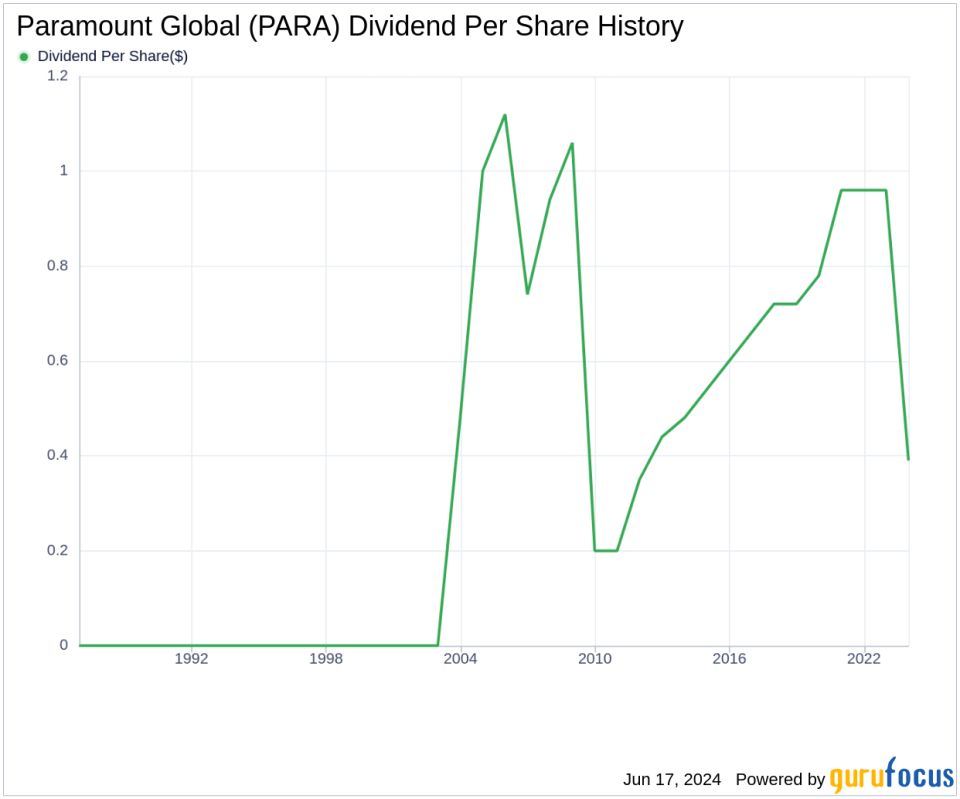
Paramount Global has maintained a consistent dividend payment record since 2003. Dividends are currently distributed on a quarterly basis. Below is a chart showing annual Dividends Per Share for tracking historical trends.
Breaking Down Paramount Global's Dividend Yield and Growth
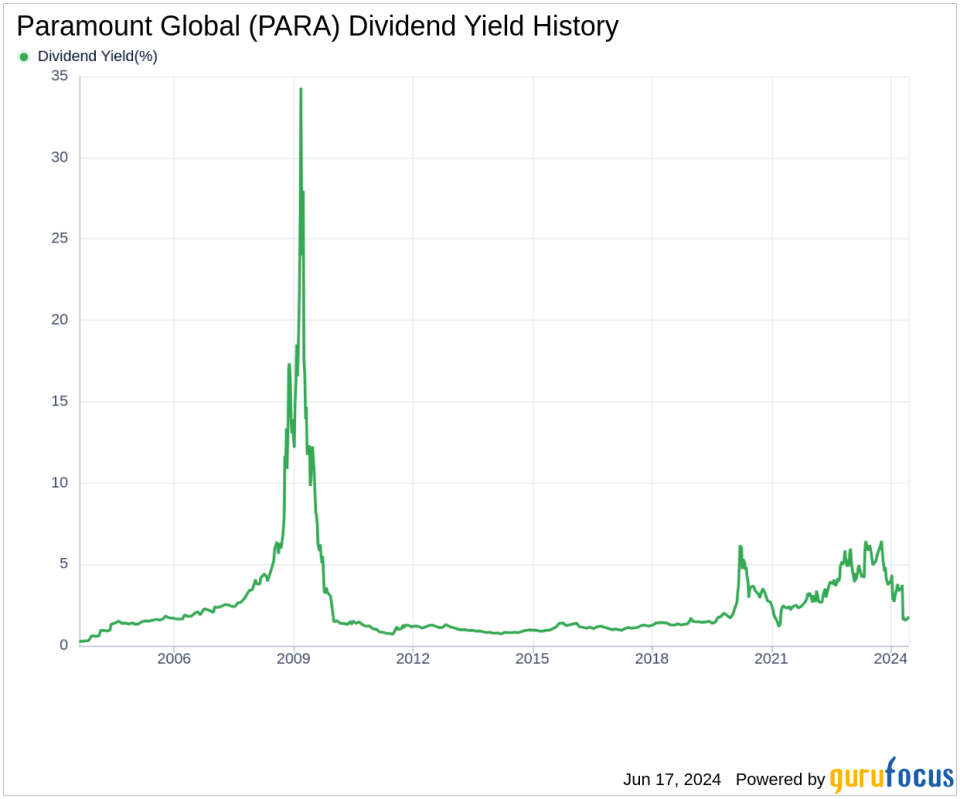
As of today, Paramount Global currently has a 12-month trailing dividend yield of 1.97% and a 12-month forward dividend yield of 1.97%. This suggests an expectation of same dividend payments over the next 12 months. Over the past three years, Paramount Global's annual dividend growth rate was -25.90%. Extended to a five-year horizon, this rate increased to -6.70% per year. And over the past decade, Paramount Global's annual dividends per share growth rate stands at 3.20%.
Based on Paramount Global's dividend yield and five-year growth rate, the 5-year yield on cost of Paramount Global stock as of today is approximately 1.39%.
The Sustainability Question: Payout Ratio and Profitability
To assess the sustainability of the dividend, one needs to evaluate the company's payout ratio. The dividend payout ratio provides insights into the portion of earnings the company distributes as dividends. A lower ratio suggests that the company retains a significant part of its earnings, thereby ensuring the availability of funds for future growth and unexpected downturns. As of 2024-03-31, Paramount Global's dividend payout ratio is 0.19.
Paramount Global's profitability rank, offers an understanding of the company's earnings prowess relative to its peers. GuruFocus ranks Paramount Global's profitability 7 out of 10 as of 2024-03-31, suggesting good profitability prospects. The company has reported net profit in 9 years out of past 10 years.
Growth Metrics: The Future Outlook
To ensure the sustainability of dividends, a company must have robust growth metrics. Paramount Global's growth rank of 7 out of 10 suggests that the company's growth trajectory is good relative to its competitors. Revenue is the lifeblood of any company, and Paramount Global's revenue per share, combined with the 3-year revenue growth rate, indicates a strong revenue model. Paramount Global's revenue has increased by approximately 3.60% per year on average, a rate that underperforms than approximately 54.62% of global competitors. The company's 3-year EPS growth rate showcases its capability to grow its earnings, a critical component for sustaining dividends in the long run. During the past three years, Paramount Global's earnings increased by approximately -50.20% per year on average, a rate that underperforms than approximately 91% of global competitors. Lastly, the company's 5-year EBITDA growth rate of -35.60%, which underperforms than approximately 96.92% of global competitors.
Conclusion
While Paramount Global's dividend history is long and its current yield is appealing, the significant decline in its dividend growth rate and mixed performance in earnings and revenue growth metrics raise questions about the long-term sustainability of its dividends. Investors should consider these factors along with the company's solid profitability rank and reasonable payout ratio when evaluating the potential for future dividend payments. Paramount Global's ability to navigate challenges and capitalize on its strategic initiatives will be crucial in maintaining its dividend payments. For more insights and tools for dividend investment strategies, GuruFocus Premium users can explore the High Dividend Yield Screener.
This article, generated by GuruFocus, is designed to provide general insights and is not tailored financial advice. Our commentary is rooted in historical data and analyst projections, utilizing an impartial methodology, and is not intended to serve as specific investment guidance. It does not formulate a recommendation to purchase or divest any stock and does not consider individual investment objectives or financial circumstances. Our objective is to deliver long-term, fundamental data-driven analysis. Be aware that our analysis might not incorporate the most recent, price-sensitive company announcements or qualitative information. GuruFocus holds no position in the stocks mentioned herein.
This article first appeared on GuruFocus.
