
 Yahoo Finance
 The past five years for DXC Technology (NYSE:DXC) investors has not been profitable
DXC Technology Company (NYSE:DXC) shareholders should be happy to see the share price up 11% in the last month. But that can't change the reality that over the longer term (five years), the returns have been really quite dismal. The share price has failed to impress anyone , down a sizable 66% during that time. Some might say the recent bounce is to be expected after such a bad drop. We'd err towards caution given the long term under-performance.
It's worthwhile assessing if the company's economics have been moving in lockstep with these underwhelming shareholder returns, or if there is some disparity between the two. So let's do just that.
See our latest analysis for DXC Technology
In his essay The Superinvestors of Graham-and-Doddsville Warren Buffett described how share prices do not always rationally reflect the value of a business. By comparing earnings per share (EPS) and share price changes over time, we can get a feel for how investor attitudes to a company have morphed over time.
During five years of share price growth, DXC Technology moved from a loss to profitability. Most would consider that to be a good thing, so it's counter-intuitive to see the share price declining. Other metrics might give us a better handle on how its value is changing over time.
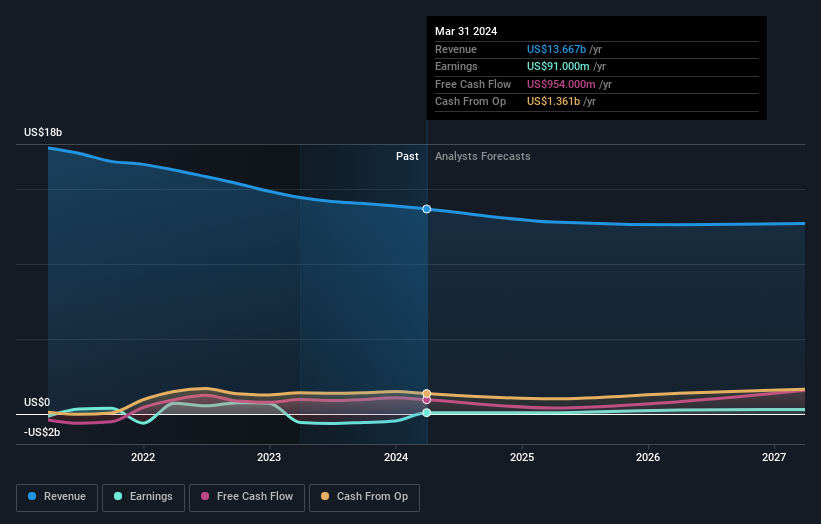
It could be that the revenue decline of 9.0% per year is viewed as evidence that DXC Technology is shrinking. This has probably encouraged some shareholders to sell down the stock.
You can see below how earnings and revenue have changed over time (discover the exact values by clicking on the image).
DXC Technology is a well known stock, with plenty of analyst coverage, suggesting some visibility into future growth. You can see what analysts are predicting for DXC Technology in this interactive graph of future profit estimates.
A Different Perspective
While the broader market gained around 24% in the last year, DXC Technology shareholders lost 33%. However, keep in mind that even the best stocks will sometimes underperform the market over a twelve month period. Unfortunately, last year's performance may indicate unresolved challenges, given that it was worse than the annualised loss of 11% over the last half decade. Generally speaking long term share price weakness can be a bad sign, though contrarian investors might want to research the stock in hope of a turnaround. While it is well worth considering the different impacts that market conditions can have on the share price, there are other factors that are even more important. Case in point: We've spotted 2 warning signs for DXC Technology you should be aware of, and 1 of them is concerning.
If you like to buy stocks alongside management, then you might just love this free list of companies. (Hint: many of them are unnoticed AND have attractive valuation).
Please note, the market returns quoted in this article reflect the market weighted average returns of stocks that currently trade on American exchanges.
Have feedback on this article? Concerned about the content? Get in touch with us directly. Alternatively, email editorial-team (at) simplywallst.com.
This article by Simply Wall St is general in nature. We provide commentary based on historical data and analyst forecasts only using an unbiased methodology and our articles are not intended to be financial advice. It does not constitute a recommendation to buy or sell any stock, and does not take account of your objectives, or your financial situation. We aim to bring you long-term focused analysis driven by fundamental data. Note that our analysis may not factor in the latest price-sensitive company announcements or qualitative material. Simply Wall St has no position in any stocks mentioned.
Have feedback on this article? Concerned about the content? Get in touch with us directly. Alternatively, email editorial-team@simplywallst.com
