
 Yahoo Finance
 The past five years for Sif Holding (AMS:SIFG) investors has not been profitable
In order to justify the effort of selecting individual stocks, it's worth striving to beat the returns from a market index fund. But even the best stock picker will only win with some selections. At this point some shareholders may be questioning their investment in Sif Holding N.V. (AMS:SIFG), since the last five years saw the share price fall 39%. Shareholders have had an even rougher run lately, with the share price down 28% in the last 90 days. But this could be related to the weak market, which is down 14% in the same period.
So let's have a look and see if the longer term performance of the company has been in line with the underlying business' progress.
View our latest analysis for Sif Holding
In his essay The Superinvestors of Graham-and-Doddsville Warren Buffett described how share prices do not always rationally reflect the value of a business. By comparing earnings per share (EPS) and share price changes over time, we can get a feel for how investor attitudes to a company have morphed over time.
Looking back five years, both Sif Holding's share price and EPS declined; the latter at a rate of 16% per year. The share price decline of 9% per year isn't as bad as the EPS decline. So investors might expect EPS to bounce back -- or they may have previously foreseen the EPS decline.
The image below shows how EPS has tracked over time (if you click on the image you can see greater detail).
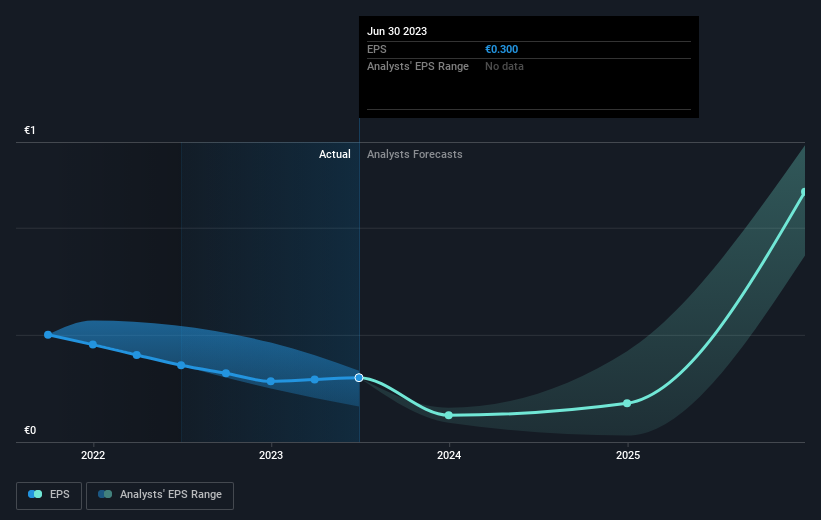
This free interactive report on Sif Holding's earnings, revenue and cash flow is a great place to start, if you want to investigate the stock further.
What About The Total Shareholder Return (TSR)?
We've already covered Sif Holding's share price action, but we should also mention its total shareholder return (TSR). The TSR is a return calculation that accounts for the value of cash dividends (assuming that any dividend received was reinvested) and the calculated value of any discounted capital raisings and spin-offs. Sif Holding's TSR of was a loss of 35% for the 5 years. That wasn't as bad as its share price return, because it has paid dividends.
A Different Perspective
Sif Holding shareholders are down 8.4% for the year, but the market itself is up 9.2%. Even the share prices of good stocks drop sometimes, but we want to see improvements in the fundamental metrics of a business, before getting too interested. Regrettably, last year's performance caps off a bad run, with the shareholders facing a total loss of 6% per year over five years. Generally speaking long term share price weakness can be a bad sign, though contrarian investors might want to research the stock in hope of a turnaround. While it is well worth considering the different impacts that market conditions can have on the share price, there are other factors that are even more important. Even so, be aware that Sif Holding is showing 2 warning signs in our investment analysis , you should know about...
For those who like to find winning investments this free list of growing companies with recent insider purchasing, could be just the ticket.
Please note, the market returns quoted in this article reflect the market weighted average returns of stocks that currently trade on Dutch exchanges.
Have feedback on this article? Concerned about the content? Get in touch with us directly. Alternatively, email editorial-team (at) simplywallst.com.
This article by Simply Wall St is general in nature. We provide commentary based on historical data and analyst forecasts only using an unbiased methodology and our articles are not intended to be financial advice. It does not constitute a recommendation to buy or sell any stock, and does not take account of your objectives, or your financial situation. We aim to bring you long-term focused analysis driven by fundamental data. Note that our analysis may not factor in the latest price-sensitive company announcements or qualitative material. Simply Wall St has no position in any stocks mentioned.
