
 Yahoo Finance
 The past three years for Heidrick & Struggles International (NASDAQ:HSII) investors has not been profitable
Many investors define successful investing as beating the market average over the long term. But if you try your hand at stock picking, you risk returning less than the market. Unfortunately, that's been the case for longer term Heidrick & Struggles International, Inc. (NASDAQ:HSII) shareholders, since the share price is down 27% in the last three years, falling well short of the market return of around 20%.
With that in mind, it's worth seeing if the company's underlying fundamentals have been the driver of long term performance, or if there are some discrepancies.
See our latest analysis for Heidrick & Struggles International
To quote Buffett, 'Ships will sail around the world but the Flat Earth Society will flourish. There will continue to be wide discrepancies between price and value in the marketplace...' By comparing earnings per share (EPS) and share price changes over time, we can get a feel for how investor attitudes to a company have morphed over time.
During five years of share price growth, Heidrick & Struggles International moved from a loss to profitability. That would generally be considered a positive, so we are surprised to see the share price is down. So given the share price is down it's worth checking some other metrics too.
With a rather small yield of just 1.8% we doubt that the stock's share price is based on its dividend. We note that, in three years, revenue has actually grown at a 9.2% annual rate, so that doesn't seem to be a reason to sell shares. It's probably worth investigating Heidrick & Struggles International further; while we may be missing something on this analysis, there might also be an opportunity.
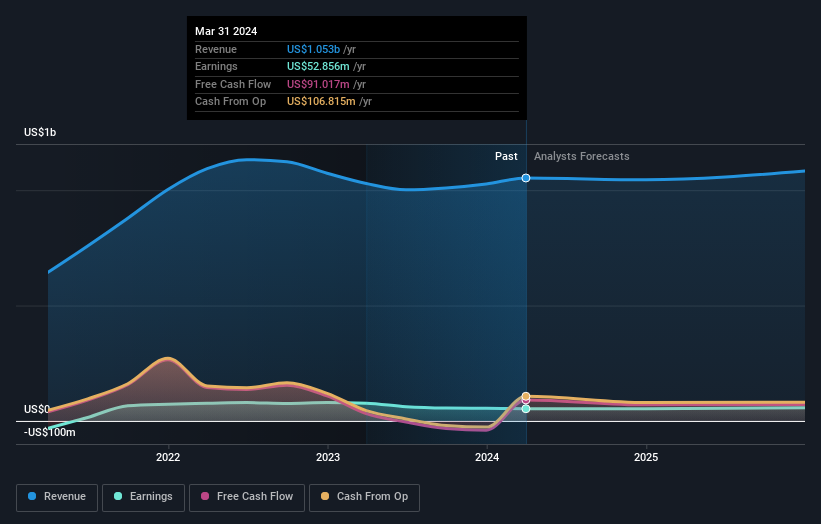
The image below shows how earnings and revenue have tracked over time (if you click on the image you can see greater detail).
You can see how its balance sheet has strengthened (or weakened) over time in this free interactive graphic.
What About Dividends?
As well as measuring the share price return, investors should also consider the total shareholder return (TSR). Whereas the share price return only reflects the change in the share price, the TSR includes the value of dividends (assuming they were reinvested) and the benefit of any discounted capital raising or spin-off. Arguably, the TSR gives a more comprehensive picture of the return generated by a stock. We note that for Heidrick & Struggles International the TSR over the last 3 years was -22%, which is better than the share price return mentioned above. And there's no prize for guessing that the dividend payments largely explain the divergence!
A Different Perspective
Heidrick & Struggles International's TSR for the year was broadly in line with the market average, at 27%. Most would be happy with a gain, and it helps that the year's return is actually better than the average return over five years, which was 5%. Even if the share price growth slows down from here, there's a good chance that this is business worth watching in the long term. It's always interesting to track share price performance over the longer term. But to understand Heidrick & Struggles International better, we need to consider many other factors. Consider for instance, the ever-present spectre of investment risk. We've identified 2 warning signs with Heidrick & Struggles International , and understanding them should be part of your investment process.
Of course, you might find a fantastic investment by looking elsewhere. So take a peek at this free list of companies we expect will grow earnings.
Please note, the market returns quoted in this article reflect the market weighted average returns of stocks that currently trade on American exchanges.
Have feedback on this article? Concerned about the content? Get in touch with us directly. Alternatively, email editorial-team (at) simplywallst.com.
This article by Simply Wall St is general in nature. We provide commentary based on historical data and analyst forecasts only using an unbiased methodology and our articles are not intended to be financial advice. It does not constitute a recommendation to buy or sell any stock, and does not take account of your objectives, or your financial situation. We aim to bring you long-term focused analysis driven by fundamental data. Note that our analysis may not factor in the latest price-sensitive company announcements or qualitative material. Simply Wall St has no position in any stocks mentioned.
Have feedback on this article? Concerned about the content? Get in touch with us directly. Alternatively, email editorial-team@simplywallst.com
