
 Yahoo Finance
 PayPoint (LON:PAY) Will Pay A Larger Dividend Than Last Year At £0.092
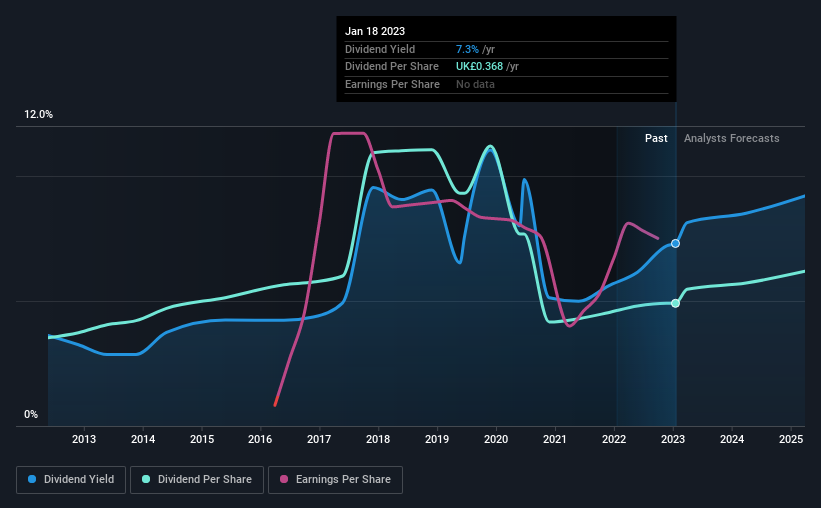
PayPoint plc's (LON:PAY) dividend will be increasing from last year's payment of the same period to £0.092 on 6th of March. This will take the annual payment to 7.3% of the stock price, which is above what most companies in the industry pay.
See our latest analysis for PayPoint
PayPoint's Dividend Is Well Covered By Earnings
Impressive dividend yields are good, but this doesn't matter much if the payments can't be sustained. PayPoint was earning enough to cover the previous dividend, but it was paying out quite a large proportion of its free cash flows. By paying out so much of its cash flows, this could indicate that the company has limited opportunities for investment and growth.
Looking forward, earnings per share is forecast to rise by 26.0% over the next year. If the dividend continues along recent trends, we estimate the payout ratio will be 52%, which is in the range that makes us comfortable with the sustainability of the dividend.
Dividend Volatility
Although the company has a long dividend history, it has been cut at least once in the last 10 years. The dividend has gone from an annual total of £0.265 in 2013 to the most recent total annual payment of £0.368. This works out to be a compound annual growth rate (CAGR) of approximately 3.3% a year over that time. We're glad to see the dividend has risen, but with a limited rate of growth and fluctuations in the payments the total shareholder return may be limited.
Dividend Growth May Be Hard To Come By
Given that the dividend has been cut in the past, we need to check if earnings are growing and if that might lead to stronger dividends in the future. Over the past five years, it looks as though PayPoint's EPS has declined at around 9.6% a year. Declining earnings will inevitably lead to the company paying a lower dividend in line with lower profits. It's not all bad news though, as the earnings are predicted to rise over the next 12 months - we would just be a bit cautious until this can turn into a longer term trend.
In Summary
In summary, while it's always good to see the dividend being raised, we don't think PayPoint's payments are rock solid. While PayPoint is earning enough to cover the dividend, we are generally unimpressed with its future prospects. Overall, we don't think this company has the makings of a good income stock.
Investors generally tend to favour companies with a consistent, stable dividend policy as opposed to those operating an irregular one. Meanwhile, despite the importance of dividend payments, they are not the only factors our readers should know when assessing a company. As an example, we've identified 2 warning signs for PayPoint that you should be aware of before investing. Is PayPoint not quite the opportunity you were looking for? Why not check out our selection of top dividend stocks.
Have feedback on this article? Concerned about the content? Get in touch with us directly. Alternatively, email editorial-team (at) simplywallst.com.
This article by Simply Wall St is general in nature. We provide commentary based on historical data and analyst forecasts only using an unbiased methodology and our articles are not intended to be financial advice. It does not constitute a recommendation to buy or sell any stock, and does not take account of your objectives, or your financial situation. We aim to bring you long-term focused analysis driven by fundamental data. Note that our analysis may not factor in the latest price-sensitive company announcements or qualitative material. Simply Wall St has no position in any stocks mentioned.
Join A Paid User Research Session
You’ll receive a US$30 Amazon Gift card for 1 hour of your time while helping us build better investing tools for the individual investors like yourself. Sign up here