
 Yahoo Finance
 Pekat Group Berhad (KLSE:PEKAT) May Have Issues Allocating Its Capital
There are a few key trends to look for if we want to identify the next multi-bagger. Amongst other things, we'll want to see two things; firstly, a growing return on capital employed (ROCE) and secondly, an expansion in the company's amount of capital employed. Basically this means that a company has profitable initiatives that it can continue to reinvest in, which is a trait of a compounding machine. However, after investigating Pekat Group Berhad (KLSE:PEKAT), we don't think it's current trends fit the mold of a multi-bagger.
Return On Capital Employed (ROCE): What Is It?
For those that aren't sure what ROCE is, it measures the amount of pre-tax profits a company can generate from the capital employed in its business. To calculate this metric for Pekat Group Berhad, this is the formula:
Return on Capital Employed = Earnings Before Interest and Tax (EBIT) ÷ (Total Assets - Current Liabilities)
0.14 = RM20m ÷ (RM185m - RM41m) (Based on the trailing twelve months to March 2024).
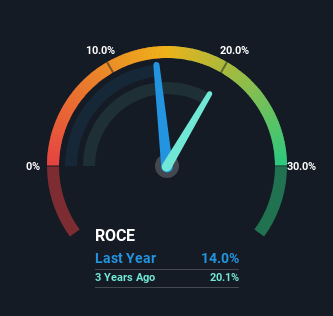
Therefore, Pekat Group Berhad has an ROCE of 14%. On its own, that's a standard return, however it's much better than the 7.7% generated by the Construction industry.
See our latest analysis for Pekat Group Berhad
Above you can see how the current ROCE for Pekat Group Berhad compares to its prior returns on capital, but there's only so much you can tell from the past. If you're interested, you can view the analysts predictions in our free analyst report for Pekat Group Berhad .
How Are Returns Trending?
On the surface, the trend of ROCE at Pekat Group Berhad doesn't inspire confidence. To be more specific, ROCE has fallen from 34% over the last five years. Although, given both revenue and the amount of assets employed in the business have increased, it could suggest the company is investing in growth, and the extra capital has led to a short-term reduction in ROCE. If these investments prove successful, this can bode very well for long term stock performance.
On a related note, Pekat Group Berhad has decreased its current liabilities to 22% of total assets. So we could link some of this to the decrease in ROCE. Effectively this means their suppliers or short-term creditors are funding less of the business, which reduces some elements of risk. Some would claim this reduces the business' efficiency at generating ROCE since it is now funding more of the operations with its own money.
The Bottom Line
While returns have fallen for Pekat Group Berhad in recent times, we're encouraged to see that sales are growing and that the business is reinvesting in its operations. In light of this, the stock has only gained 19% over the last three years. Therefore we'd recommend looking further into this stock to confirm if it has the makings of a good investment.
Like most companies, Pekat Group Berhad does come with some risks, and we've found 1 warning sign that you should be aware of.
While Pekat Group Berhad isn't earning the highest return, check out this free list of companies that are earning high returns on equity with solid balance sheets.
Have feedback on this article? Concerned about the content? Get in touch with us directly. Alternatively, email editorial-team (at) simplywallst.com.
This article by Simply Wall St is general in nature. We provide commentary based on historical data and analyst forecasts only using an unbiased methodology and our articles are not intended to be financial advice. It does not constitute a recommendation to buy or sell any stock, and does not take account of your objectives, or your financial situation. We aim to bring you long-term focused analysis driven by fundamental data. Note that our analysis may not factor in the latest price-sensitive company announcements or qualitative material. Simply Wall St has no position in any stocks mentioned.
Have feedback on this article? Concerned about the content? Get in touch with us directly. Alternatively, email editorial-team@simplywallst.com
