
 Yahoo Finance
 Is Pennon Group Plc's (LON:PNN) Recent Performancer Underpinned By Weak Financials?
Pennon Group (LON:PNN) has had a rough three months with its share price down 8.4%. We decided to study the company's financials to determine if the downtrend will continue as the long-term performance of a company usually dictates market outcomes. Specifically, we decided to study Pennon Group's ROE in this article.
ROE or return on equity is a useful tool to assess how effectively a company can generate returns on the investment it received from its shareholders. Simply put, it is used to assess the profitability of a company in relation to its equity capital.
View our latest analysis for Pennon Group
How Do You Calculate Return On Equity?
ROE can be calculated by using the formula:
Return on Equity = Net Profit (from continuing operations) ÷ Shareholders' Equity
So, based on the above formula, the ROE for Pennon Group is:
2.7% = UK£79m ÷ UK£2.9b (Based on the trailing twelve months to September 2020).
The 'return' is the amount earned after tax over the last twelve months. That means that for every £1 worth of shareholders' equity, the company generated £0.03 in profit.
What Is The Relationship Between ROE And Earnings Growth?
So far, we've learned that ROE is a measure of a company's profitability. We now need to evaluate how much profit the company reinvests or "retains" for future growth which then gives us an idea about the growth potential of the company. Assuming all else is equal, companies that have both a higher return on equity and higher profit retention are usually the ones that have a higher growth rate when compared to companies that don't have the same features.
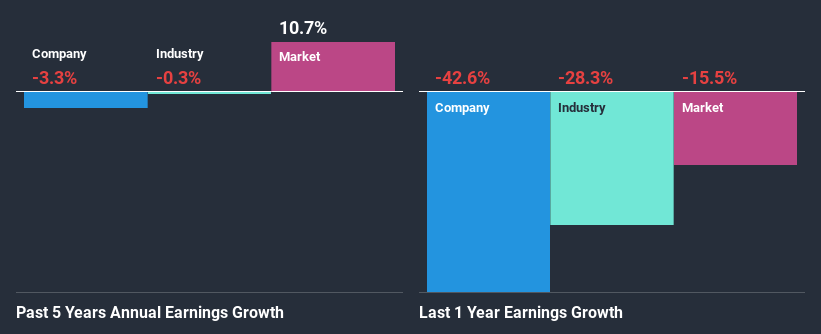
A Side By Side comparison of Pennon Group's Earnings Growth And 2.7% ROE
As you can see, Pennon Group's ROE looks pretty weak. Even compared to the average industry ROE of 6.2%, the company's ROE is quite dismal. Given the circumstances, the significant decline in net income by 3.3% seen by Pennon Group over the last five years is not surprising. We reckon that there could also be other factors at play here. For instance, the company has a very high payout ratio, or is faced with competitive pressures.
However, when we compared Pennon Group's growth with the industry we found that while the company's earnings have been shrinking, the industry has seen an earnings growth of 7.5% in the same period. This is quite worrisome.
Earnings growth is a huge factor in stock valuation. What investors need to determine next is if the expected earnings growth, or the lack of it, is already built into the share price. By doing so, they will have an idea if the stock is headed into clear blue waters or if swampy waters await. One good indicator of expected earnings growth is the P/E ratio which determines the price the market is willing to pay for a stock based on its earnings prospects. So, you may want to check if Pennon Group is trading on a high P/E or a low P/E, relative to its industry.
Is Pennon Group Using Its Retained Earnings Effectively?
Pennon Group's declining earnings is not surprising given how the company is spending most of its profits in paying dividends, judging by its three-year median payout ratio of 96% (or a retention ratio of 4.3%). With only a little being reinvested into the business, earnings growth would obviously be low or non-existent. To know the 4 risks we have identified for Pennon Group visit our risks dashboard for free.
Moreover, Pennon Group has been paying dividends for at least ten years or more suggesting that management must have perceived that the shareholders prefer dividends over earnings growth. Upon studying the latest analysts' consensus data, we found that the company's future payout ratio is expected to drop to 73% over the next three years. As a result, the expected drop in Pennon Group's payout ratio explains the anticipated rise in the company's future ROE to 4.5%, over the same period.
Conclusion
Overall, we would be extremely cautious before making any decision on Pennon Group. The low ROE, combined with the fact that the company is paying out almost if not all, of its profits as dividends, has resulted in the lack or absence of growth in its earnings. Additionally, the latest industry analyst forecasts show that analysts expect the company's earnings to continue to shrink in the future. To know more about the company's future earnings growth forecasts take a look at this free report on analyst forecasts for the company to find out more.
This article by Simply Wall St is general in nature. It does not constitute a recommendation to buy or sell any stock, and does not take account of your objectives, or your financial situation. We aim to bring you long-term focused analysis driven by fundamental data. Note that our analysis may not factor in the latest price-sensitive company announcements or qualitative material. Simply Wall St has no position in any stocks mentioned.
Have feedback on this article? Concerned about the content? Get in touch with us directly. Alternatively, email editorial-team (at) simplywallst.com.
