
 Yahoo Finance
 Petards Group plc (LON:PEG) Looks Inexpensive After Falling 36% But Perhaps Not Attractive Enough
The Petards Group plc (LON:PEG) share price has fared very poorly over the last month, falling by a substantial 36%. For any long-term shareholders, the last month ends a year to forget by locking in a 59% share price decline.
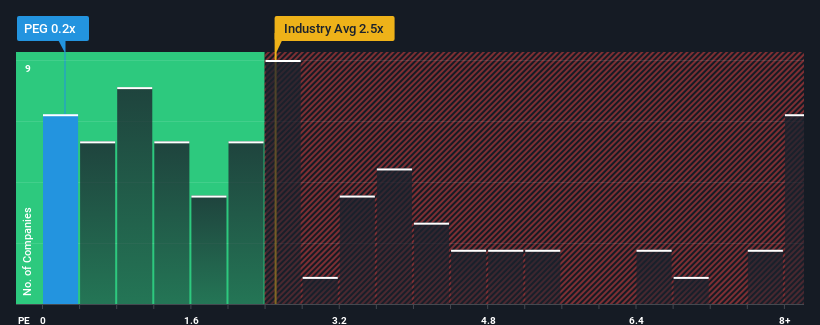
Although its price has dipped substantially, Petards Group's price-to-sales (or "P/S") ratio of 0.2x might still make it look like a strong buy right now compared to the wider Software industry in the United Kingdom, where around half of the companies have P/S ratios above 2.5x and even P/S above 5x are quite common. Although, it's not wise to just take the P/S at face value as there may be an explanation why it's so limited.
View our latest analysis for Petards Group
How Petards Group Has Been Performing
Petards Group hasn't been tracking well recently as its declining revenue compares poorly to other companies, which have seen some growth in their revenues on average. It seems that many are expecting the poor revenue performance to persist, which has repressed the P/S ratio. If you still like the company, you'd be hoping this isn't the case so that you could potentially pick up some stock while it's out of favour.
Keen to find out how analysts think Petards Group's future stacks up against the industry? In that case, our free report is a great place to start.
What Are Revenue Growth Metrics Telling Us About The Low P/S?
In order to justify its P/S ratio, Petards Group would need to produce anemic growth that's substantially trailing the industry.
In reviewing the last year of financials, we were disheartened to see the company's revenues fell to the tune of 14%. This means it has also seen a slide in revenue over the longer-term as revenue is down 30% in total over the last three years. Accordingly, shareholders would have felt downbeat about the medium-term rates of revenue growth.
Turning to the outlook, the next year should generate growth of 6.1% as estimated by the two analysts watching the company. That's shaping up to be materially lower than the 10% growth forecast for the broader industry.
With this information, we can see why Petards Group is trading at a P/S lower than the industry. It seems most investors are expecting to see limited future growth and are only willing to pay a reduced amount for the stock.
What Does Petards Group's P/S Mean For Investors?
Shares in Petards Group have plummeted and its P/S has followed suit. It's argued the price-to-sales ratio is an inferior measure of value within certain industries, but it can be a powerful business sentiment indicator.
As we suspected, our examination of Petards Group's analyst forecasts revealed that its inferior revenue outlook is contributing to its low P/S. Right now shareholders are accepting the low P/S as they concede future revenue probably won't provide any pleasant surprises. The company will need a change of fortune to justify the P/S rising higher in the future.
And what about other risks? Every company has them, and we've spotted 3 warning signs for Petards Group (of which 2 are significant!) you should know about.
Of course, profitable companies with a history of great earnings growth are generally safer bets. So you may wish to see this free collection of other companies that have reasonable P/E ratios and have grown earnings strongly.
Have feedback on this article? Concerned about the content? Get in touch with us directly. Alternatively, email editorial-team (at) simplywallst.com.
This article by Simply Wall St is general in nature. We provide commentary based on historical data and analyst forecasts only using an unbiased methodology and our articles are not intended to be financial advice. It does not constitute a recommendation to buy or sell any stock, and does not take account of your objectives, or your financial situation. We aim to bring you long-term focused analysis driven by fundamental data. Note that our analysis may not factor in the latest price-sensitive company announcements or qualitative material. Simply Wall St has no position in any stocks mentioned.
