
 Yahoo Finance
 Planet Fitness (PLNT) Stock Up on Q3 Earnings Beat & Upbeat View
Planet Fitness, Inc. PLNT reported solid third-quarter 2021 results, with earnings and revenues surpassing the Zacks Consensus Estimate as well as increasing on a year-over-year basis. The company benefitted from a rise in membership levels along with positive system-wide same store sales growth. It raised its 2021 earnings guidance. Following the robust results and an upbeat view, shares of the company moved up 11.7% during trading hours on Nov 4.
Earnings & Revenue Discussion
During the third quarter, the company reported adjusted earnings per share (EPS) of 25 cents, which surpassed the Zacks Consensus Estimate of 17 cents by 47.1%. In the prior-year quarter, the company reported adjusted earnings of 2 cents per share.
Total adjusted EBITDA at the end of the third quarter came in at $62.2 million compared with $32 million reported in the year-ago quarter.
Planet Fitness, Inc. Price, Consensus and EPS Surprise
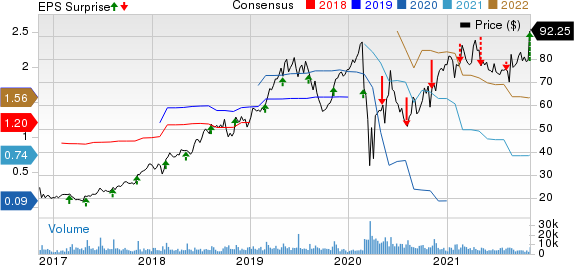
Planet Fitness, Inc. price-consensus-eps-surprise-chart | Planet Fitness, Inc. Quote
Quarterly revenues of $154.3 million beat the consensus mark of $136 million by 13.6%. The top line also surged 46.4% from the year-ago quarter’s levels on account of solid performances in the Franchise, Corporate-owned Stores and Equipment segments. During the quarter, system-wide same store sales increased 7.2% year over year.
Segmental Performance
During third-quarter 2021, Franchise segment revenues came in at $75.4 million compared with $59.8 million in the prior-year quarter. The upside was primarily driven by a rise in franchise royalty revenues ($10 million), NAF revenues ($1.3 million), franchise and other fees ($3.2 million). EBITDA in the Franchise segment came in at $52 million compared with $31.1 million in the prior-year quarter.
The Corporate-owned Stores segment’s third-quarter revenues came in at $43.9 million compared with $28.3 million in the prior-year quarter. The upside was primarily driven by the resumption of operations at its temporarily-closed stores and revenues accumulated from the opening of seven new corporate-owned stores (since Jul 1, 2020). The segment’s EBITDA came in at $14.1 million compared with $5.7 million reported in the prior-year quarter.
In the Equipment segment, revenues totaled $35 million compared with $17.3 million in the prior-year quarter. The uptick was primarily driven by higher equipment sales to new and existing franchisee-owned stores and discount offerings. EBITDA in the Equipment segment came in at $7.9 million compared with $2.3 million in the prior-year quarter.
Other Financial Details
As of Sep 30, 2021, cash and cash equivalents totaled $527.3 million compared with $469.1 million as of Jun 30, 2021. Long-term debt (net of current maturities) amounted to $1,668.1 million at the end of third-quarter 2021 compared with $1,670.8 million at prior-quarter end.
2021 Outlook
For 2021, the company expects revenues in the range of $570-$580 million, up from the prior estimate of $530-$540 million. Selling, General & Administrative expenses are anticipated in the low-to-mid $90-million range.
Adjusted EBITDA for 2021 is estimated between $210-$220 million, up from the prior expectation of $200 and $210 million range. Adjusted net income per share, diluted, for 2021 is anticipated between 75 cents and 80 cents, up from the prior estimate of 65-70 cents. The metrics are based on the assumption that there is no significant worsening of the COVID-19 pandemic that seriously impacts performance, including prolonged store closures or other mandated operational restrictions.
The company anticipates new store openings for 2021 in the range of 110-120, up from the prior expectation of 75-100.
Zacks Rank & Stocks to Consider
Planet Fitness currently has a Zacks Rank #3 (Hold). You can see the complete list of today’s Zacks #1 Rank (Strong Buy) stocks here.
Some better-ranked stocks in the Zacks Consumer Discretionary sector include Golden Entertainment, Inc. GDEN, Camping World Holdings, Inc. CWH and RCI Hospitality Holdings, Inc. RICK. Golden Entertainment sports a Zacks rank #1, while Camping World and RCI Hospitality carry a Zacks Rank #2 (Buy).
Golden Entertainment’s 2021 earnings are expected to surge 232.1%.
Camping World has a trailing four-quarter earnings surprise of 70.9%, on average.
RCI Hospitality has three-five-year EPS growth rate of 12%.
Want the latest recommendations from Zacks Investment Research? Today, you can download 7 Best Stocks for the Next 30 Days. Click to get this free report
Camping World (CWH) : Free Stock Analysis Report
RCI Hospitality Holdings, Inc. (RICK) : Free Stock Analysis Report
Planet Fitness, Inc. (PLNT) : Free Stock Analysis Report
Golden Entertainment, Inc. (GDEN) : Free Stock Analysis Report
To read this article on Zacks.com click here.
