
 Yahoo Finance
 Positive earnings growth hasn't been enough to get ZOO Digital Group (LON:ZOO) shareholders a favorable return over the last year
ZOO Digital Group plc (LON:ZOO) has rebounded strongly over the last week, with the share price soaring 35%. But that isn't much consolation for the painful drop we've seen in the last year. Specifically, the stock price nose-dived 70% in that time. So it's not that amazing to see a bit of a bounce. The bigger issue is whether the company can sustain the momentum in the long term.
On a more encouraging note the company has added UK£13m to its market cap in just the last 7 days, so let's see if we can determine what's driven the one-year loss for shareholders.
See our latest analysis for ZOO Digital Group
While the efficient markets hypothesis continues to be taught by some, it has been proven that markets are over-reactive dynamic systems, and investors are not always rational. One way to examine how market sentiment has changed over time is to look at the interaction between a company's share price and its earnings per share (EPS).
ZOO Digital Group stole the show with its EPS rocketing, in the last year. We don't think the growth guide to the sustainable growth rate in this case, but we do think this sort of increase is impressive. As a result, we're surprised to see the weak share price. Some different data might shed some more light on the situation.
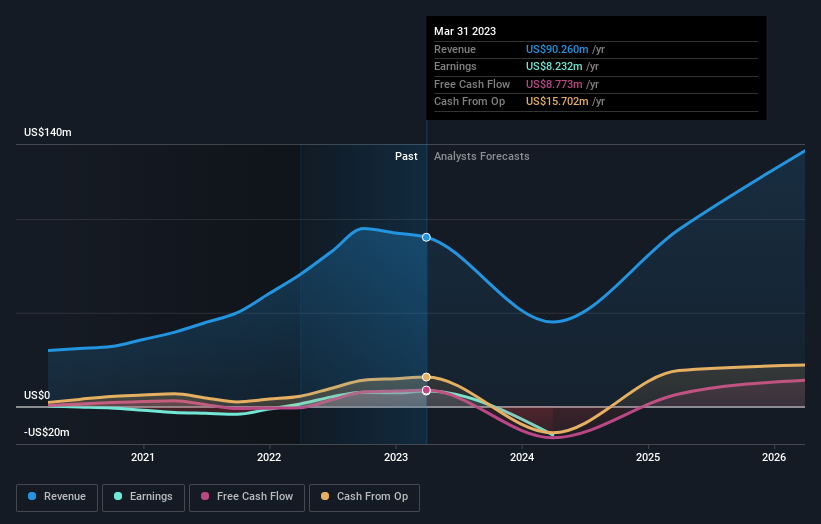
ZOO Digital Group's revenue is actually up 28% over the last year. Since we can't easily explain the share price movement based on these metrics, it might be worth considering how market sentiment has changed towards the stock.
You can see how earnings and revenue have changed over time in the image below (click on the chart to see the exact values).
It's good to see that there was some significant insider buying in the last three months. That's a positive. That said, we think earnings and revenue growth trends are even more important factors to consider. So it makes a lot of sense to check out what analysts think ZOO Digital Group will earn in the future (free profit forecasts).
A Different Perspective
While the broader market gained around 1.6% in the last year, ZOO Digital Group shareholders lost 70%. However, keep in mind that even the best stocks will sometimes underperform the market over a twelve month period. Unfortunately, last year's performance may indicate unresolved challenges, given that it was worse than the annualised loss of 10% over the last half decade. We realise that Baron Rothschild has said investors should "buy when there is blood on the streets", but we caution that investors should first be sure they are buying a high quality business. I find it very interesting to look at share price over the long term as a proxy for business performance. But to truly gain insight, we need to consider other information, too. To that end, you should be aware of the 3 warning signs we've spotted with ZOO Digital Group .
There are plenty of other companies that have insiders buying up shares. You probably do not want to miss this free list of growing companies that insiders are buying.
Please note, the market returns quoted in this article reflect the market weighted average returns of stocks that currently trade on British exchanges.
Have feedback on this article? Concerned about the content? Get in touch with us directly. Alternatively, email editorial-team (at) simplywallst.com.
This article by Simply Wall St is general in nature. We provide commentary based on historical data and analyst forecasts only using an unbiased methodology and our articles are not intended to be financial advice. It does not constitute a recommendation to buy or sell any stock, and does not take account of your objectives, or your financial situation. We aim to bring you long-term focused analysis driven by fundamental data. Note that our analysis may not factor in the latest price-sensitive company announcements or qualitative material. Simply Wall St has no position in any stocks mentioned.
