
 Yahoo Finance
 Profit margins among Big 6 energy firms running at record levels, says Ofgem

Profit margins at the Big 6 energy firms have hit record levels, the watchdog Ofgem has revealed.
The average pre-tax margin among the major power companies rose to 4.48% in 2016, up from 4.15% the year before.
Margins stood at just 0.89% in 2009, when the regulator began collecting figures. The figures come just weeks after British Gas upped electricity prices by 12.5%.
MORE: Petrol is about to get way more expensive in the UK thanks to Hurricane Harvey
Centrica, which owns British Gas, boasted the highest margins, running at 7.18% in 2016. SSE and E.ON were the second most profitable, both on a margin of 6.95%.
However, the statistics also show that dual fuel bills for households served by the largest suppliers have come down.
In 2013, an average dual fuel bill stood at £1,286, dropping to £1,190 a year later, £1,165 in 2015 and £1,123 last year.
Ofgem revealed that SSE is the only supplier to have grown its margins every year since 2013. It serves some 7.7 million households in the UK.
MORE: Ofgem to launch consultation on energy price cap by end-September
Information was provided by the energy suppliers themselves which was standardised to show the difference between reported revenues and profits of each supplier, once its costs, depreciation and other factors are subtracted.

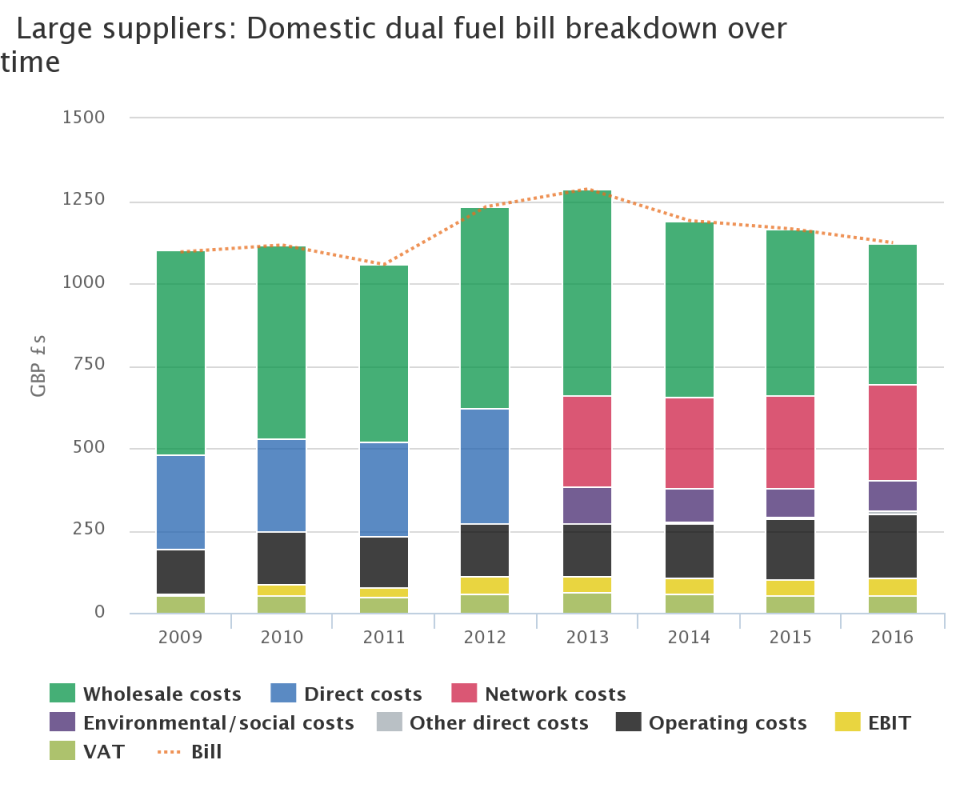
A breakdown of where your money is spent (Source: Ofgem)A breakdown of where the money goes from bills reveals the cost of meeting environmental and social obligations has been falling.
Energy companies have often used this area as one measure to explain upping prices but Ofgem shows “greening” costs fells from £109 on a typical dual fuel bill in 2009 to £86 in 2015. It did rise to £91 last year.
MORE: Third of top companies paying living wage, as Diageo commits to higher rate
During the election campaign, Theresa May pledged to cap bills for 17 million families on the worst-value energy tariffs, but the plan was missing from the Queen’s speech.
The number of consumers switching electricity suppliers to find better deals reached 380,000 in June, the highest level since June 2011, while gas switching was at its highest since June 2009.
The watchdog announced in August it was lowering the level of a temporary price cap on prepayment meters first introduced in April.
It said bills should go down by up to £19 a year for three million customers who rely on prepayment meters for their energy, following on from a £80 drop when the cap first came into force.
