
 Yahoo Finance
 q.beyond (ETR:QBY) shareholders have endured a 65% loss from investing in the stock three years ago
While not a mind-blowing move, it is good to see that the q.beyond AG (ETR:QBY) share price has gained 12% in the last three months. But that is small recompense for the exasperating returns over three years. In that time, the share price dropped 65%. So it's good to see it climbing back up. After all, could be that the fall was overdone.
With that in mind, it's worth seeing if the company's underlying fundamentals have been the driver of long term performance, or if there are some discrepancies.
See our latest analysis for q.beyond
Given that q.beyond didn't make a profit in the last twelve months, we'll focus on revenue growth to form a quick view of its business development. Generally speaking, companies without profits are expected to grow revenue every year, and at a good clip. That's because it's hard to be confident a company will be sustainable if revenue growth is negligible, and it never makes a profit.
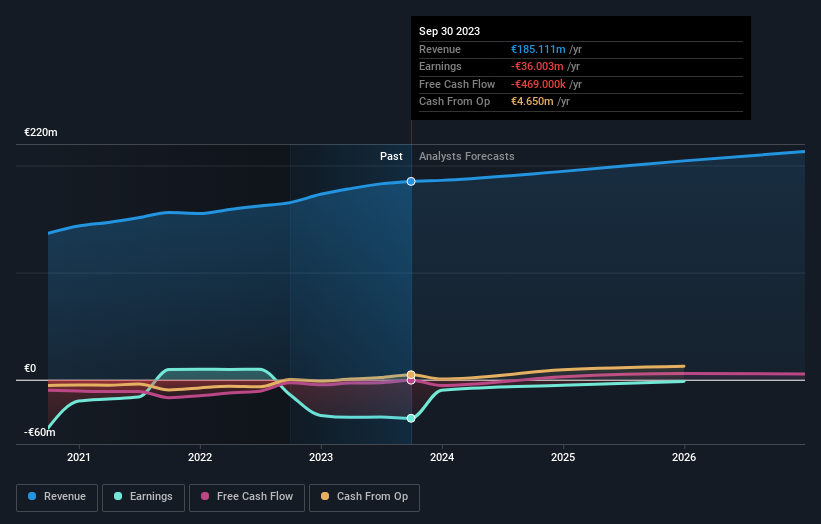
In the last three years, q.beyond saw its revenue grow by 9.6% per year, compound. That's a fairly respectable growth rate. That contrasts with the weak share price, which has fallen 18% compounded, over three years. To be frank we're surprised to see revenue growth and share price growth diverge so strongly. It would be well worth taking a closer look at the company, to determine growth trends (and balance sheet strength).
The graphic below depicts how earnings and revenue have changed over time (unveil the exact values by clicking on the image).
This free interactive report on q.beyond's balance sheet strength is a great place to start, if you want to investigate the stock further.
A Different Perspective
q.beyond shareholders are down 38% for the year, but the market itself is up 1.1%. However, keep in mind that even the best stocks will sometimes underperform the market over a twelve month period. Regrettably, last year's performance caps off a bad run, with the shareholders facing a total loss of 8% per year over five years. We realise that Baron Rothschild has said investors should "buy when there is blood on the streets", but we caution that investors should first be sure they are buying a high quality business. I find it very interesting to look at share price over the long term as a proxy for business performance. But to truly gain insight, we need to consider other information, too. Take risks, for example - q.beyond has 2 warning signs we think you should be aware of.
We will like q.beyond better if we see some big insider buys. While we wait, check out this free list of growing companies with considerable, recent, insider buying.
Please note, the market returns quoted in this article reflect the market weighted average returns of stocks that currently trade on German exchanges.
Have feedback on this article? Concerned about the content? Get in touch with us directly. Alternatively, email editorial-team (at) simplywallst.com.
This article by Simply Wall St is general in nature. We provide commentary based on historical data and analyst forecasts only using an unbiased methodology and our articles are not intended to be financial advice. It does not constitute a recommendation to buy or sell any stock, and does not take account of your objectives, or your financial situation. We aim to bring you long-term focused analysis driven by fundamental data. Note that our analysis may not factor in the latest price-sensitive company announcements or qualitative material. Simply Wall St has no position in any stocks mentioned.
