
 Yahoo Finance
 Rakon (NZSE:RAK) investors are up 10% in the past week, but earnings have declined over the last five years
The worst result, after buying shares in a company (assuming no leverage), would be if you lose all the money you put in. But on a lighter note, a good company can see its share price rise well over 100%. Long term Rakon Limited (NZSE:RAK) shareholders would be well aware of this, since the stock is up 282% in five years. Also pleasing for shareholders was the 86% gain in the last three months.
After a strong gain in the past week, it's worth seeing if longer term returns have been driven by improving fundamentals.
Check out our latest analysis for Rakon
While markets are a powerful pricing mechanism, share prices reflect investor sentiment, not just underlying business performance. One imperfect but simple way to consider how the market perception of a company has shifted is to compare the change in the earnings per share (EPS) with the share price movement.
Rakon's earnings per share are down 7.2% per year, despite strong share price performance over five years.
This means it's unlikely the market is judging the company based on earnings growth. Because earnings per share don't seem to match up with the share price, we'll take a look at other metrics instead.
We doubt the modest 1.2% dividend yield is attracting many buyers to the stock. In contrast revenue growth of 11% per year is probably viewed as evidence that Rakon is growing, a real positive. In that case, the company may be sacrificing current earnings per share to drive growth.
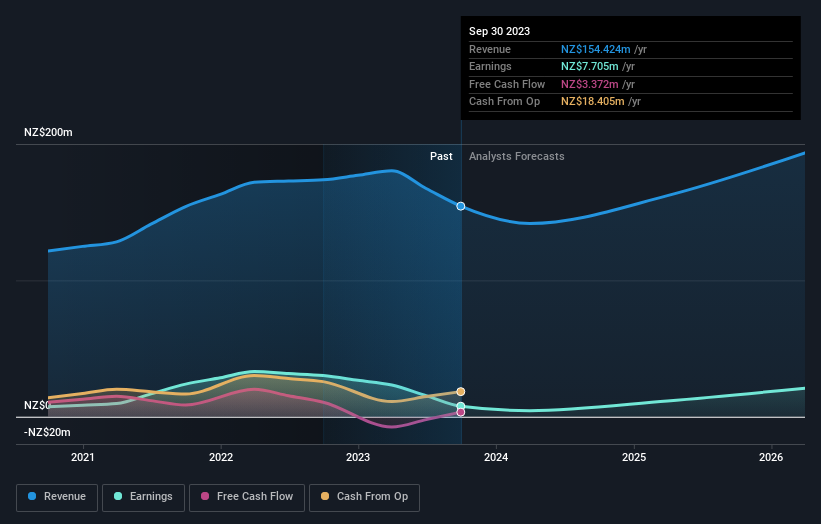
You can see how earnings and revenue have changed over time in the image below (click on the chart to see the exact values).
Take a more thorough look at Rakon's financial health with this free report on its balance sheet.
What About Dividends?
It is important to consider the total shareholder return, as well as the share price return, for any given stock. Whereas the share price return only reflects the change in the share price, the TSR includes the value of dividends (assuming they were reinvested) and the benefit of any discounted capital raising or spin-off. It's fair to say that the TSR gives a more complete picture for stocks that pay a dividend. As it happens, Rakon's TSR for the last 5 years was 291%, which exceeds the share price return mentioned earlier. This is largely a result of its dividend payments!
A Different Perspective
It's nice to see that Rakon shareholders have received a total shareholder return of 27% over the last year. Of course, that includes the dividend. Having said that, the five-year TSR of 31% a year, is even better. I find it very interesting to look at share price over the long term as a proxy for business performance. But to truly gain insight, we need to consider other information, too. Take risks, for example - Rakon has 2 warning signs (and 1 which makes us a bit uncomfortable) we think you should know about.
If you like to buy stocks alongside management, then you might just love this free list of companies. (Hint: insiders have been buying them).
Please note, the market returns quoted in this article reflect the market weighted average returns of stocks that currently trade on New Zealander exchanges.
Have feedback on this article? Concerned about the content? Get in touch with us directly. Alternatively, email editorial-team (at) simplywallst.com.
This article by Simply Wall St is general in nature. We provide commentary based on historical data and analyst forecasts only using an unbiased methodology and our articles are not intended to be financial advice. It does not constitute a recommendation to buy or sell any stock, and does not take account of your objectives, or your financial situation. We aim to bring you long-term focused analysis driven by fundamental data. Note that our analysis may not factor in the latest price-sensitive company announcements or qualitative material. Simply Wall St has no position in any stocks mentioned.
