
 Yahoo Finance
 REA Group (ASX:REA) Will Want To Turn Around Its Return Trends
Did you know there are some financial metrics that can provide clues of a potential multi-bagger? Amongst other things, we'll want to see two things; firstly, a growing return on capital employed (ROCE) and secondly, an expansion in the company's amount of capital employed. This shows us that it's a compounding machine, able to continually reinvest its earnings back into the business and generate higher returns. So while REA Group (ASX:REA) has a high ROCE right now, lets see what we can decipher from how returns are changing.
Return On Capital Employed (ROCE): What Is It?
For those who don't know, ROCE is a measure of a company's yearly pre-tax profit (its return), relative to the capital employed in the business. Analysts use this formula to calculate it for REA Group:
Return on Capital Employed = Earnings Before Interest and Tax (EBIT) ÷ (Total Assets - Current Liabilities)
0.26 = AU$622m ÷ (AU$2.7b - AU$321m) (Based on the trailing twelve months to December 2023).
So, REA Group has an ROCE of 26%. In absolute terms that's a great return and it's even better than the Interactive Media and Services industry average of 8.0%.
See our latest analysis for REA Group
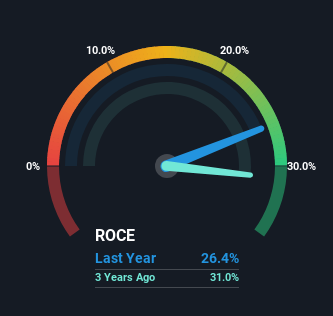
Above you can see how the current ROCE for REA Group compares to its prior returns on capital, but there's only so much you can tell from the past. If you're interested, you can view the analysts predictions in our free report on analyst forecasts for the company.
How Are Returns Trending?
On the surface, the trend of ROCE at REA Group doesn't inspire confidence. While it's comforting that the ROCE is high, five years ago it was 41%. Meanwhile, the business is utilizing more capital but this hasn't moved the needle much in terms of sales in the past 12 months, so this could reflect longer term investments. It's worth keeping an eye on the company's earnings from here on to see if these investments do end up contributing to the bottom line.
On a side note, REA Group has done well to pay down its current liabilities to 12% of total assets. So we could link some of this to the decrease in ROCE. What's more, this can reduce some aspects of risk to the business because now the company's suppliers or short-term creditors are funding less of its operations. Since the business is basically funding more of its operations with it's own money, you could argue this has made the business less efficient at generating ROCE.
The Key Takeaway
In summary, REA Group is reinvesting funds back into the business for growth but unfortunately it looks like sales haven't increased much just yet. Investors must think there's better things to come because the stock has knocked it out of the park, delivering a 153% gain to shareholders who have held over the last five years. However, unless these underlying trends turn more positive, we wouldn't get our hopes up too high.
One more thing to note, we've identified 1 warning sign with REA Group and understanding it should be part of your investment process.
REA Group is not the only stock earning high returns. If you'd like to see more, check out our free list of companies earning high returns on equity with solid fundamentals.
Have feedback on this article? Concerned about the content? Get in touch with us directly. Alternatively, email editorial-team (at) simplywallst.com.
This article by Simply Wall St is general in nature. We provide commentary based on historical data and analyst forecasts only using an unbiased methodology and our articles are not intended to be financial advice. It does not constitute a recommendation to buy or sell any stock, and does not take account of your objectives, or your financial situation. We aim to bring you long-term focused analysis driven by fundamental data. Note that our analysis may not factor in the latest price-sensitive company announcements or qualitative material. Simply Wall St has no position in any stocks mentioned.
