
 Yahoo Finance
 REA Group Limited's (ASX:REA) Stock Has Shown A Decent Performance: Have Financials A Role To Play?
REA Group's (ASX:REA) stock up by 6.0% over the past three months. As most would know, long-term fundamentals have a strong correlation with market price movements, so we decided to look at the company's key financial indicators today to determine if they have any role to play in the recent price movement. Particularly, we will be paying attention to REA Group's ROE today.
Return on equity or ROE is a key measure used to assess how efficiently a company's management is utilizing the company's capital. Put another way, it reveals the company's success at turning shareholder investments into profits.
Check out our latest analysis for REA Group
How Is ROE Calculated?
The formula for return on equity is:
Return on Equity = Net Profit (from continuing operations) ÷ Shareholders' Equity
So, based on the above formula, the ROE for REA Group is:
18% = AU$272m ÷ AU$1.5b (Based on the trailing twelve months to December 2023).
The 'return' refers to a company's earnings over the last year. One way to conceptualize this is that for each A$1 of shareholders' capital it has, the company made A$0.18 in profit.
What Is The Relationship Between ROE And Earnings Growth?
We have already established that ROE serves as an efficient profit-generating gauge for a company's future earnings. We now need to evaluate how much profit the company reinvests or "retains" for future growth which then gives us an idea about the growth potential of the company. Generally speaking, other things being equal, firms with a high return on equity and profit retention, have a higher growth rate than firms that don’t share these attributes.
REA Group's Earnings Growth And 18% ROE
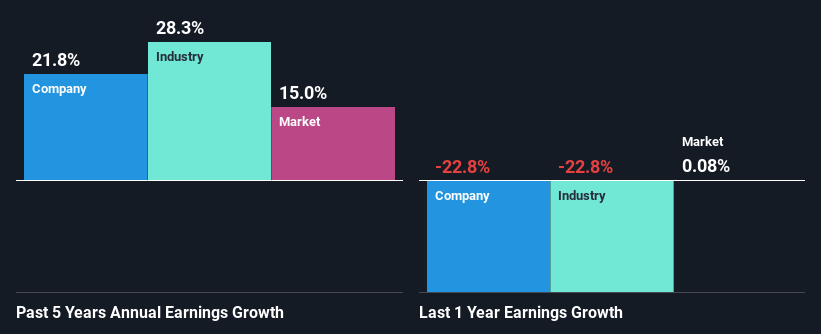
To start with, REA Group's ROE looks acceptable. Further, the company's ROE compares quite favorably to the industry average of 8.1%. Probably as a result of this, REA Group was able to see an impressive net income growth of 22% over the last five years. However, there could also be other causes behind this growth. For example, it is possible that the company's management has made some good strategic decisions, or that the company has a low payout ratio.
We then compared REA Group's net income growth with the industry and found that the company's growth figure is lower than the average industry growth rate of 28% in the same 5-year period, which is a bit concerning.
Earnings growth is an important metric to consider when valuing a stock. The investor should try to establish if the expected growth or decline in earnings, whichever the case may be, is priced in. This then helps them determine if the stock is placed for a bright or bleak future. If you're wondering about REA Group's's valuation, check out this gauge of its price-to-earnings ratio, as compared to its industry.
Is REA Group Using Its Retained Earnings Effectively?
The high three-year median payout ratio of 59% (implying that it keeps only 41% of profits) for REA Group suggests that the company's growth wasn't really hampered despite it returning most of the earnings to its shareholders.
Moreover, REA Group is determined to keep sharing its profits with shareholders which we infer from its long history of paying a dividend for at least ten years. Based on the latest analysts' estimates, we found that the company's future payout ratio over the next three years is expected to hold steady at 58%. However, REA Group's ROE is predicted to rise to 30% despite there being no anticipated change in its payout ratio.
Conclusion
Overall, we feel that REA Group certainly does have some positive factors to consider. The company has grown its earnings moderately as previously discussed. Still, the high ROE could have been even more beneficial to investors had the company been reinvesting more of its profits. As highlighted earlier, the current reinvestment rate appears to be quite low. We also studied the latest analyst forecasts and found that the company's earnings growth is expected be similar to its current growth rate. To know more about the latest analysts predictions for the company, check out this visualization of analyst forecasts for the company.
Have feedback on this article? Concerned about the content? Get in touch with us directly. Alternatively, email editorial-team (at) simplywallst.com.
This article by Simply Wall St is general in nature. We provide commentary based on historical data and analyst forecasts only using an unbiased methodology and our articles are not intended to be financial advice. It does not constitute a recommendation to buy or sell any stock, and does not take account of your objectives, or your financial situation. We aim to bring you long-term focused analysis driven by fundamental data. Note that our analysis may not factor in the latest price-sensitive company announcements or qualitative material. Simply Wall St has no position in any stocks mentioned.
