
 Yahoo Finance
 Read This Before You Buy Xplus S.A. (WSE:XPL) Because Of Its P/E Ratio

Want to participate in a short research study? Help shape the future of investing tools and you could win a $250 gift card!
Today, we'll introduce the concept of the P/E ratio for those who are learning about investing. We'll show how you can use Xplus S.A.'s (WSE:XPL) P/E ratio to inform your assessment of the investment opportunity. Based on the last twelve months, Xplus's P/E ratio is 8.97. In other words, at today's prices, investors are paying PLN8.97 for every PLN1 in prior year profit.
Check out our latest analysis for Xplus
How Do You Calculate A P/E Ratio?
The formula for P/E is:
Price to Earnings Ratio = Price per Share ÷ Earnings per Share (EPS)
Or for Xplus:
P/E of 8.97 = PLN0.34 ÷ PLN0.038 (Based on the trailing twelve months to December 2018.)
Is A High Price-to-Earnings Ratio Good?
A higher P/E ratio implies that investors pay a higher price for the earning power of the business. All else being equal, it's better to pay a low price -- but as Warren Buffett said, 'It's far better to buy a wonderful company at a fair price than a fair company at a wonderful price.'
How Growth Rates Impact P/E Ratios
Probably the most important factor in determining what P/E a company trades on is the earnings growth. When earnings grow, the 'E' increases, over time. And in that case, the P/E ratio itself will drop rather quickly. A lower P/E should indicate the stock is cheap relative to others -- and that may attract buyers.
Xplus increased earnings per share by a whopping 46% last year. And earnings per share have improved by 12% annually, over the last five years. So we'd generally expect it to have a relatively high P/E ratio.
Does Xplus Have A Relatively High Or Low P/E For Its Industry?
We can get an indication of market expectations by looking at the P/E ratio. We can see in the image below that the average P/E (13.1) for companies in the software industry is higher than Xplus's P/E.
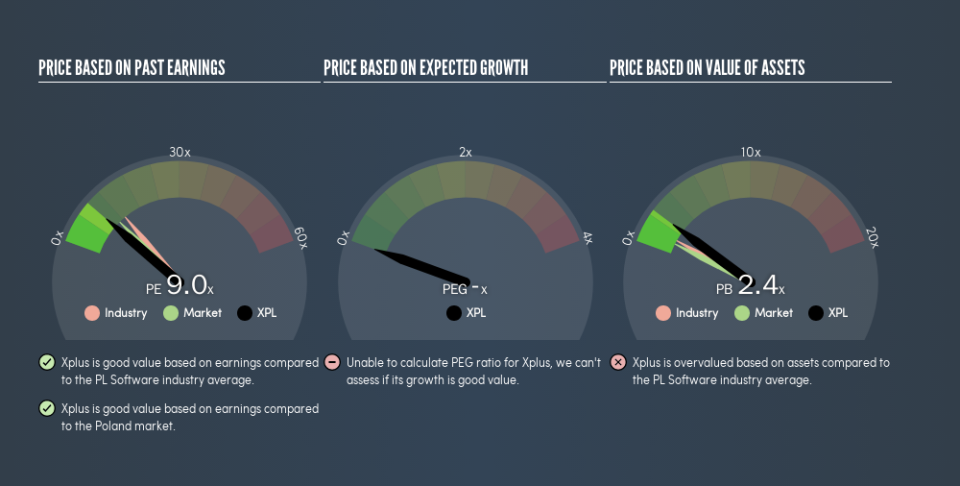
This suggests that market participants think Xplus will underperform other companies in its industry. While current expectations are low, the stock could be undervalued if the situation is better than the market assumes. It is arguably worth checking if insiders are buying shares, because that might imply they believe the stock is undervalued.
A Limitation: P/E Ratios Ignore Debt and Cash In The Bank
It's important to note that the P/E ratio considers the market capitalization, not the enterprise value. In other words, it does not consider any debt or cash that the company may have on the balance sheet. The exact same company would hypothetically deserve a higher P/E ratio if it had a strong balance sheet, than if it had a weak one with lots of debt, because a cashed up company can spend on growth.
Such expenditure might be good or bad, in the long term, but the point here is that the balance sheet is not reflected by this ratio.
How Does Xplus's Debt Impact Its P/E Ratio?
Xplus has net cash of zł4.2m. This is fairly high at 18% of its market capitalization. That might mean balance sheet strength is important to the business, but should also help push the P/E a bit higher than it would otherwise be.
The Bottom Line On Xplus's P/E Ratio
Xplus's P/E is 9 which is below average (10.7) in the PL market. It grew its EPS nicely over the last year, and the healthy balance sheet implies there is more potential for growth. The relatively low P/E ratio implies the market is pessimistic.
When the market is wrong about a stock, it gives savvy investors an opportunity. If it is underestimating a company, investors can make money by buying and holding the shares until the market corrects itself. We don't have analyst forecasts, but shareholders might want to examine this detailed historical graph of earnings, revenue and cash flow.
You might be able to find a better buy than Xplus. If you want a selection of possible winners, check out this freelist of interesting companies that trade on a P/E below 20 (but have proven they can grow earnings).
We aim to bring you long-term focused research analysis driven by fundamental data. Note that our analysis may not factor in the latest price-sensitive company announcements or qualitative material.
If you spot an error that warrants correction, please contact the editor at editorial-team@simplywallst.com. This article by Simply Wall St is general in nature. It does not constitute a recommendation to buy or sell any stock, and does not take account of your objectives, or your financial situation. Simply Wall St has no position in the stocks mentioned. Thank you for reading.
