
 Yahoo Finance
 Reasons to Add HEICO (HEI) Stock to Your Portfolio Now
HEICO Corporation HEI, with rising earnings estimates, robust ROE and low debt, offers a great investment opportunity in the aerospace sector.
Let’s focus on the reasons that make this Zacks Rank #2 (Buy) stock an attractive investment pick at the moment.
Solid Growth Projections & Surprise History
The Zacks Consensus Estimate for HEI’s fiscal 2024 earnings per share (EPS) has increased 1.7% to $3.53 in the past 60 days. The Zacks Consensus Estimate for the company’s total revenues for fiscal 2024 stands at $3.86 million, which indicates growth of 30.2% from the 2023 reported figure.
The company’s long-term (three to five years) earnings growth rate is pegged at 18.9%. It delivered an average earnings surprise of 11.6% in the last four quarters.
Return on Equity
Return on equity (ROE) indicates how efficiently a company has been utilizing its funds to generate higher returns. Currently, HEICO’s ROE is 14.26% compared to its industry’s average of 11.64%. This indicates that the company has been utilizing its funds more constructively than its peers in the sector.
Solvency
HEI’s times interest earned ratio (TIE) at the end of the second quarter of fiscal 2024 was 5.5. The TIE ratio of more than 1 indicates that the company will be able to meet its interest payment obligations in the near term without any problems.
Currently, HEICO’s total debt to capital is 40.97%, much better than the industry’s average of 54.13%.
Liquidity
HEI’s current ratio at the end of the second quarter of fiscal 2024 was 3.52. The ratio being greater than one indicates the company’s ability to meet its future short-term liabilities without difficulties.
Price Performance
In the past six months, HEI shares have surged 24.8% compared with its industry’s return of 15.9%.
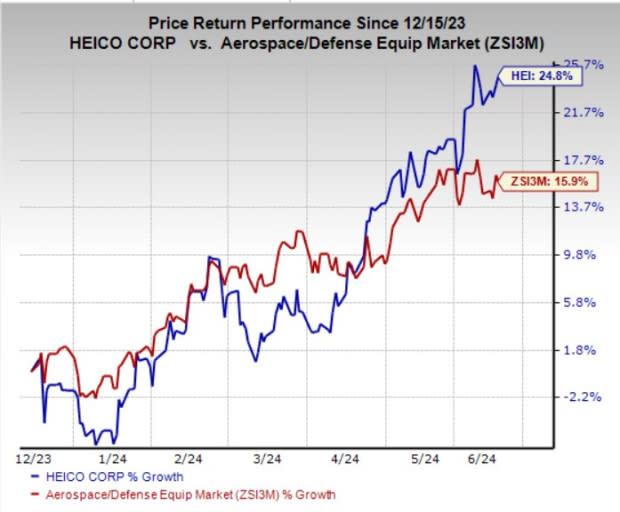
Image Source: Zacks Investment Research
Other Stocks to Consider
A few other top-ranked stocks from the same sector are Leidos Holdings, Inc. LDOS, which sports a Zacks Rank #1 (Strong Buy), and BAE Systems BAESY and Safran SAFRY, each carrying a Zacks Rank #2 at present. You can see the complete list of today’s Zacks #1 Rank stocks here.
Leidos’ long-term earnings growth rate is pegged at 11.1%. The Zacks Consensus Estimate for LDOS’ 2024 sales is pegged at $16.07 billion, which indicates an improvement of 4.1% from the 2023 reported sales figure.
BAE Systems’ long-term earnings growth rate is pegged at 12.2%. The Zacks Consensus Estimate for BAESY’s 2024 sales is pegged at $35.26 billion, which implies an improvement of 34.1% from the 2023 reported sales figure.
Safran’s long-term earnings growth rate is pegged at 34.7%. The Zacks Consensus Estimate for SAFRY’s 2024 sales is pegged at $29.4 billion, which indicates a rise of 42.9% from the 2023 reported sales figure.
Want the latest recommendations from Zacks Investment Research? Today, you can download 7 Best Stocks for the Next 30 Days. Click to get this free report
Bae Systems PLC (BAESY) : Free Stock Analysis Report
Safran SA (SAFRY) : Free Stock Analysis Report
Heico Corporation (HEI) : Free Stock Analysis Report
Leidos Holdings, Inc. (LDOS) : Free Stock Analysis Report
