
 Yahoo Finance
 There Are Reasons To Feel Uneasy About Etherstack's (ASX:ESK) Returns On Capital
If we want to find a stock that could multiply over the long term, what are the underlying trends we should look for? Ideally, a business will show two trends; firstly a growing return on capital employed (ROCE) and secondly, an increasing amount of capital employed. Basically this means that a company has profitable initiatives that it can continue to reinvest in, which is a trait of a compounding machine. However, after investigating Etherstack (ASX:ESK), we don't think it's current trends fit the mold of a multi-bagger.
What Is Return On Capital Employed (ROCE)?
If you haven't worked with ROCE before, it measures the 'return' (pre-tax profit) a company generates from capital employed in its business. The formula for this calculation on Etherstack is:
Return on Capital Employed = Earnings Before Interest and Tax (EBIT) ÷ (Total Assets - Current Liabilities)
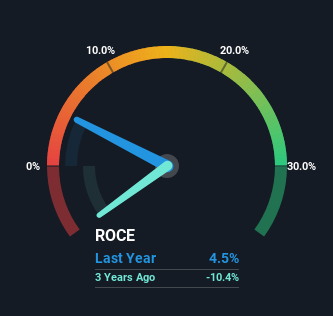
0.045 = US$564k ÷ (US$16m - US$3.9m) (Based on the trailing twelve months to December 2023).
Therefore, Etherstack has an ROCE of 4.5%. Ultimately, that's a low return and it under-performs the Software industry average of 13%.
See our latest analysis for Etherstack
Above you can see how the current ROCE for Etherstack compares to its prior returns on capital, but there's only so much you can tell from the past. If you'd like, you can check out the forecasts from the analysts covering Etherstack for free.
What Does the ROCE Trend For Etherstack Tell Us?
When we looked at the ROCE trend at Etherstack, we didn't gain much confidence. Over the last five years, returns on capital have decreased to 4.5% from 14% five years ago. On the other hand, the company has been employing more capital without a corresponding improvement in sales in the last year, which could suggest these investments are longer term plays. It's worth keeping an eye on the company's earnings from here on to see if these investments do end up contributing to the bottom line.
On a related note, Etherstack has decreased its current liabilities to 24% of total assets. Since the ratio used to be 98%, that's a significant reduction and it no doubt explains the drop in ROCE. Effectively this means their suppliers or short-term creditors are funding less of the business, which reduces some elements of risk. Some would claim this reduces the business' efficiency at generating ROCE since it is now funding more of the operations with its own money.
What We Can Learn From Etherstack's ROCE
Bringing it all together, while we're somewhat encouraged by Etherstack's reinvestment in its own business, we're aware that returns are shrinking. Unsurprisingly then, the total return to shareholders over the last five years has been flat. On the whole, we aren't too inspired by the underlying trends and we think there may be better chances of finding a multi-bagger elsewhere.
One more thing: We've identified 4 warning signs with Etherstack (at least 2 which make us uncomfortable) , and understanding them would certainly be useful.
While Etherstack may not currently earn the highest returns, we've compiled a list of companies that currently earn more than 25% return on equity. Check out this free list here.
Have feedback on this article? Concerned about the content? Get in touch with us directly. Alternatively, email editorial-team (at) simplywallst.com.
This article by Simply Wall St is general in nature. We provide commentary based on historical data and analyst forecasts only using an unbiased methodology and our articles are not intended to be financial advice. It does not constitute a recommendation to buy or sell any stock, and does not take account of your objectives, or your financial situation. We aim to bring you long-term focused analysis driven by fundamental data. Note that our analysis may not factor in the latest price-sensitive company announcements or qualitative material. Simply Wall St has no position in any stocks mentioned.
